Beamscanner
-
Posts
925 -
Joined
-
Last visited
-
Days Won
2


-

DLSS, DLAA, thanks but going back to MSAA
Beamscanner replied to slughead's topic in Virtual Reality
DLSS is really bad with MFDs... -
Latest newsletter covering this was awesome!
-
$200 + shipping HP Reverb G1 in excellent condition with original box. All cables and both controllers come with it and work. PM if interested.
-
HPRF FMR (HPRF RWS/TWS) 1 vs 2 PRFs For this to work, a 3 stage FMR would be required for each PRF. Thus, you have the following options: 1 PRF / 3 FMRs = ToT/3 + Eclipsing loss (1-3 dB of loss) 2 PRFs / 6 FMRs = ToT/6 The math shows use that option 1 gives better range (even with the added 3 dB eclipsing loss) than option 2. Thus, option is used because we double our integration time over option 2. You are correct for VS mode (HPRF no FMR). It typically does use 2 PRFs to reduce eclipsing loss. IDK where you got your input power figures. But as I said before, the hughes aircraft doc (F-15 Radar BIT) indicates that the GTWT output power check requires a minimum power of 1360 Watts and says that this represents the MPRF waveform (page 68 in that doc). We know that MPRF duty cycle is typically 5 - 15%. We can extrapolate the usable input power from this very easily. Best Case (5% Duty Cycle): Usable input power = 1360 * (1/.05) Usable input power = 1360 * 20 Usable input power = 27200 Watts This is unlikely. Most probable Case (10% Duty Cycle): Usable input power = 1360 * (1/.1) Usable input power = 1360 * 10 Usable input power = 13600 Watts This is likely. Worst Case (15% Duty Cycle): Usable input power = 1360 * (1/.15) Usable input power = 1360 * 6.67 Usable input power = 9067 Watts This is unlikely. Even in the worst case scenario, the input power would need to be much higher than your statement: "From that I know, typical fighter radar has Pavg about 1-2kw." Its very likely, based on multiple references that the APG-63 TWT peak power is ~13500 Watts. I know that you're more concerned about the APG-73. But I dont have any figures on that. Additionally, TWTs are cavity resonators. Meaning they build energy over time. Resonance does not break the law of conservation of energy. This video describes how a microwave oven, with an input of say 1000 Watts will generate internal powers of much higher strength. TWTs are not microwave ovens, in that they do not contain standing waves like microwave ovens. TWTs are however resonant cavities though, and do add up energy over time because they generate 'slow wave' oscillations where energy is continuously added up over time as that slow wave propagates down the tube. This occurs in a short period of time, and continues for the duration of a single pulse.
-
Attached is my recommendation for ED, as well as some of my excel sheets. I've put a lot into these sheets, so if anyone has any questions about the math please ask. The main equation I think ED should use is the SNR equation. Its in both docs. My PPT explains the benefits of using it. I think ED should use Phase 2 to implement Pd detection (it also effects azimuth/bar settings like they previously mentioned, but not directly). I think ED should hold off on look-down and altitude loss until Phase 3. As usual, everything contained within is open-source / non-ITAR / never been classified at any level, ever. Its all just physics and theory from reputable sources. Its mostly equations derived from: Intro to air (George Stimson; all 3 editions) Air and Spaceborne Radar Systems Radar Handbook V2 I'm recommending resolution cells of: MPRF Range: 150m Doppler: 10 Knots HPRF Range: 4000m Doppler: 3 Knots Be applied to all radars, when their true values are unknown. These values are generic and typical values one would see from a Pulse Doppler AA Radar. The point isn't to have a specific radars real values. The purpose is to: Show that these radars do not measure targets with perfect accuracy That MPRF and HPRF have pros and cons to resolution That targets within a res cell (must be within all 3 domains at same time; Beamwidth, Range AND Doppler) merge into 'one' large target/RCS. EDIT: Fixed Gain sheet in excel. It was missing the formulas. Beamscanner's Pd Detection recommendation.pptx Beamscanners Basic Radar Equations v1.2.xlsx
-
For Pavg: The CP-140 document indicates that the APG-63 GTWT amp has a peak power of ~12900 Watts. This seems correct for a GTWT amplifier built for high duty cycle. A public Tennessee.edu doc indicates that the GTWT amplifier from the APG-66 (built for low duty cycle, and high peak power) has an output power of 21000 Watts. A non controlled hughes aircraft doc (F-15 Radar BIT) indicates that the GTWT output power check requires a minimum power of 1360 Watts and says that this represents the MPRF waveform (page 68 in that doc). If we assume both the CP-140 doc and the F-15 Radar Bit doc are correct, this would indicate that the 1360 Watt (Pavg) figure is only the 10% duty cycle for the GTWT. This duty cycle is in fact typical for MPRF modes. In HPRF, the typical duty cycle is 30 - 50%. Thus I believe my estimated Pavg for high PRF of 5850 Watts to be accurate (13000 * 0.45 = 5850). I think you are locked into input vs output power. The problem is that you are forgetting physics. Just like a microwave oven, energy is built up over time due to resonance within the cavity (or tube in the case of the GTWT). A 1000 Watt beam of 2.4GHz microwaves would not cook food in free space. But in a resonant cavity, that energy builds up over time can increase that internal power to tens of thousands of Watts. This is how a 1000 Watt microwave oven can actually cook food within. HPRF FMR CPI: I believe you're wrong. Many HPRF radars simply change PRF bar to bar. No need to guess though. The CPI time is exactly 8.6 milliseconds per FMR stage. This is described in the non-ITAR / Not controlled Hughes 'F-15 Radar Bit' document. Page 66 shows that there are 3 CPIs (a 4th stage exists at the beginning, but this is not processed and thus not a "CPI"), each CPI being 8.6 milliseconds long.
-
First off, I really like the mathematical approach ED is taking. So kudos to you and the team. 2. My APG-63 analysis has the figures you were missing (Pavg, (S/N)req, and L). Pavg is calculated from Ppeak (found in the CP-140 document) * duty cycle (Intro to airborne radar 1st edition mentions that the APG-63 in HPRF uses 1 range bin (ie 50% duty cycle; which I made 45% to account for receiver recovery time). SNR was difficult, but I calculated everything you would need here. SNR is key to understanding Probability of detection. Scroll to the bottom of that excel I made, you will see a chart I made that shows SNR per mode for any given pulse doppler Air radar. In my APG-63 analysis, you can see my losses chart. Using generic information from various radar sources I estimated about 10.5dB of losses in the APG-63 for HPRF. (ex radome losses are typically 0.5 dB per path, ie 1dB of loss to the radome in total) 3. Without seeing your full equation, the SNR and losses you chose, I cannot fully compare our two papers. 4. I suspect you may be using the full time on target (tot) in your equation. Keep in mind that in HPRF RWS/TWS, 3 stage FMR is used to range doppler targets. Thus the integration time for the equation is actually ToT/3. In MPRF, 7-9 PRFs may be used (radar dependent), in which case integration time would actually be ToT/8. I look forward to continued discussion on this. EDIT: I am willing to share my google sheets that I've built up over a year or so. However, I'd like to share it in a way so that each individual gets a copy without effecting someone else's copy (ie I don't want a single shared copy/link). If anyone knows google sheets, please PM me the correct way to do this. Converting to excel disrupts my graphs.. I already tried that.
- 31 replies
-
- 10
-

-
Its much closer to reality in general performance. But I think the APG-68 RWS (ie MPRF) is still too high. I will do an analysis of my own on it since its figures exist to the public.
-
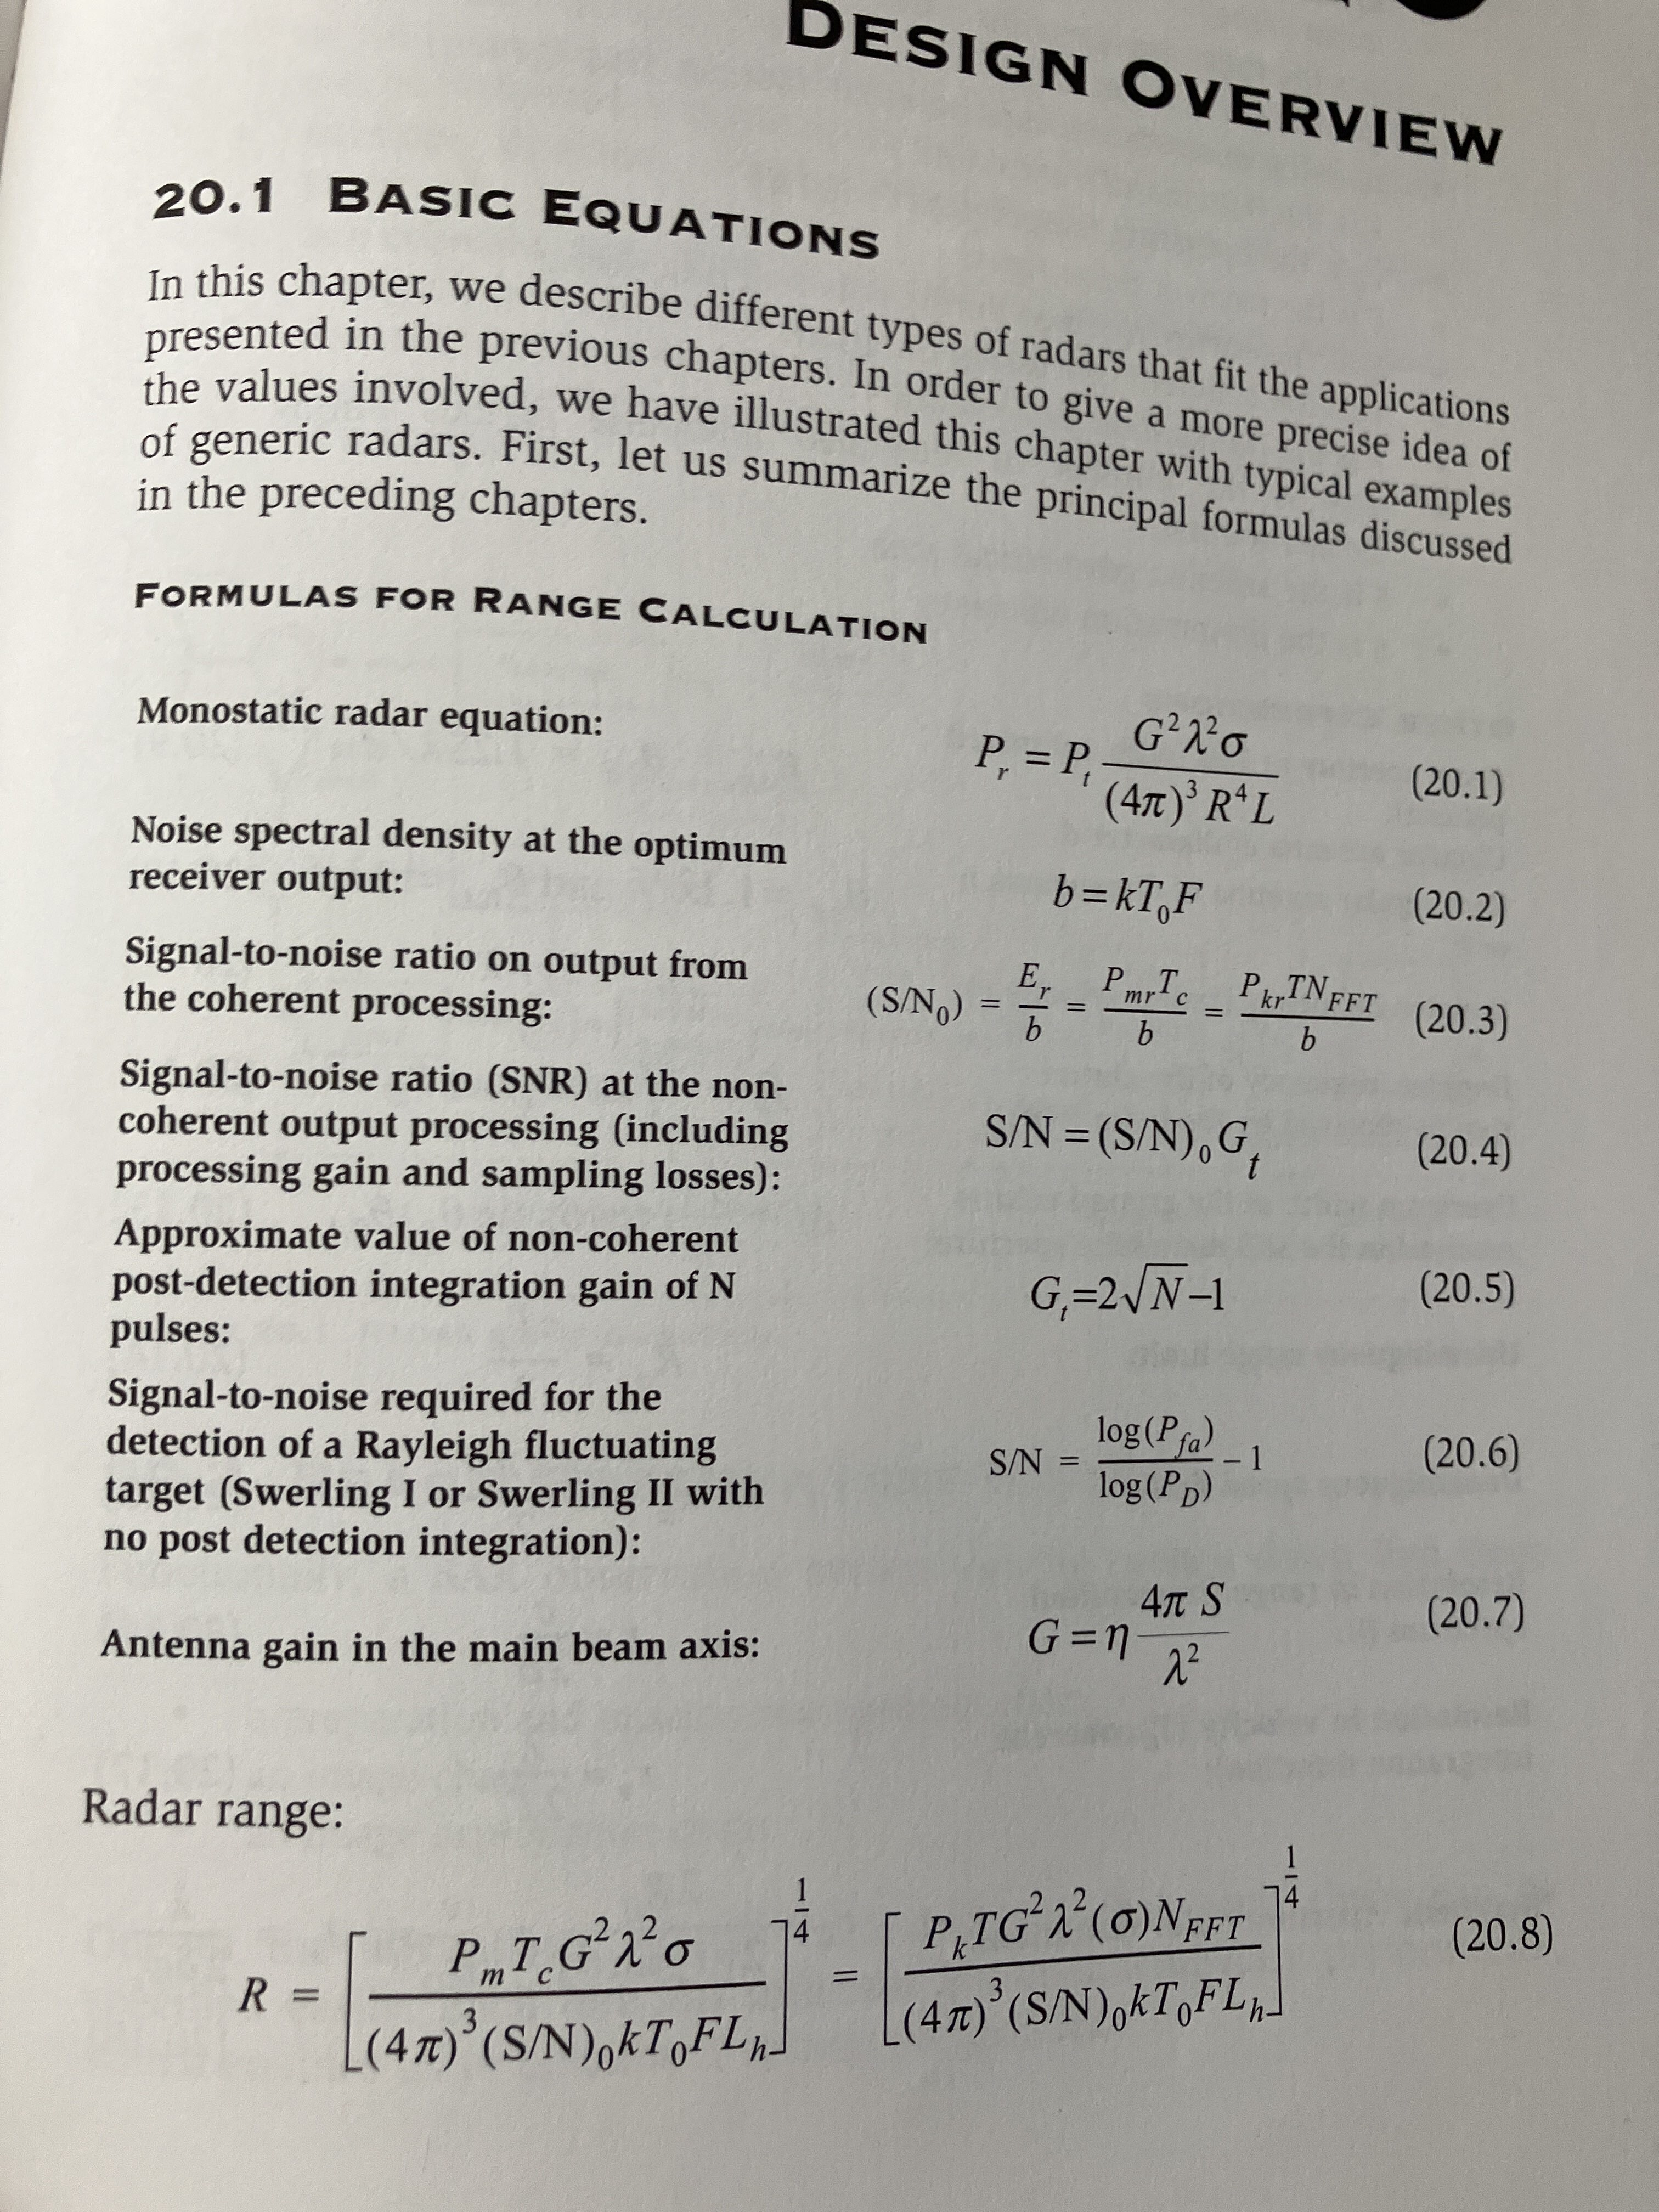
A mathematically gifted friend of mine found the reason for the extra 4pi. (4pi)^2 is in relation to expansion of light spherically as I stated earlier. The extra 4pi comes from effective area ("Ae"; not depicted in the formula). You can see in the top that Gain is squared. In truth it would be Gain * Ae. Where Ae = (lamda^2/4pi)*Gain Ae refers to the effective receiving area of the antenna aperture. So the author altered the formula for simplicity sake.
-
Yes, that was a typo. It is as you assumed. I meant to say (4pi)^3. The excel formula has it correct, its just the adjacent text that has the typo. (4pi)^2 relates to the area of a sphere, in which the transmitted signal propagates outward and expands spherically. I'm not sure how (4pi)^2 becomes (4pi)^3 in the radar range equation. Yes, this all assumes meters. I will have to do some research on why it is cubed. The source for this equation is depicted in equation (20.8):

-
The biggest difficulty besides finding the Noise Figure for a given radar, was figuring out the SNR for each Pd, per mode. This is key to developing a single scan Pd for a radar. To save ED the trouble, I'm attaching an excel spread sheet which contains the SNR figures for a swirling case 1 target (fluctuating air target), with a Probability of false alarm of 10^-6 (typical of modern fighter radars). It calculates the SNR per mode given binomial distribution probability of "M of N detection logic". Examples: 1. HPRF RWS uses 3 stage FMR for ranging (ie 3 separate coherent processing intervals or CPIs). "Single Burst" (ie single CPI) SNR for 50% Pd = 12.8dB. Given that all 3 CPIs need to detect the target (M of N = 3 of 3), if 12.8dB were used, a single scan Pd would result in a Pd of 12.5%, not 50%. (0.5 * 0.5 * 0.5 = 0.125) Thus a higher "Single Burst" SNR is require to determine single scan Pd. In this case, a 17.6dB SNR gives about 80% Pd per CPI. given that this mode uses 3 CPIs AND requires target detection in all 3 CPIs, this 17.6 dB SNR results in a single scan SNR of 50%. (0.8 * 0.8 * 0.8 = 0.5) 2. MPRF logic is different. Typical M of N detection logic for MPRF is 3 of 8. That is a minimum of 3 detections given a total of 8 CPIs per time on target. What you will see is that because we get 8 chances to 'flip a coin' and we only need 'three chances to get heads' (where 'heads' = detection). The required SNR for a given Pd is less than HPRFs 3 of 3. In truth though, MPRF can almost guarantee that 1 - 2 of its CPIs wont ever see the target due to range and doppler eclipsing. Various sources indicate that on average targets only exist in clear region 57 - 65 % of MPRF CPIs. I've simplified this logic by including a duty cycle input. For example if a MPRF using 8 CPIs has a duty of 15%, Ive made it so that the calculated Pd/SNR treats the M of N logic not as 3 of 8, but as 3 of * (8 * (1 - duty cycle) where duty cycle is indicative of probability of eclipsing. Thus the single scan probability of detection for 3 of 8 MPRF search mode would actually be 3 of 6.8. Simply plug in your duty cycle and choose the mode of interest and use that SNR on the far left to determine the single scan Pd when applied to the radar range equation. Edit: I've added the reference for Single Burst SNR (Swirling Case 1). Again, this is not the Single Scan SNR that SHOULD be used for actual detection. Single Scan SNR can be found in my attached excel. SNR Figures.xlsx
- 31 replies
-
- 16
-
-
ED has stated that Phase Two of their radar development will include azimuth/bar settings effecting detection performance. "Upon Phase 1 release and tuning, we will implement Phase 2 that will include the effect of radar azimuth and bar settings on detection ranges and the inclusion of more accurate look down radar performance." This is not a correct application of radar theory. The radar range equation does not contain azimuth or bar values in it. Azimuth and bar settings only effect what is has been called Max Range Cumulative detection performance. Which indicates a typical range the radar will first see a target. See my full explanation here. But in short it is a simple way of telling a high ranking officer the typical range he could expect his first detection. Though this does not inform the officer that the detections will be rare/irregular at this range. Azimuth and bar settings have little to no effect on performance. This is a misnomer told to pilots. Detection range performance is based on a probability of detecting a RCS at a given range. ex the APG-66 has a 10% chance of detecting a T-38 at 20 Nmi in a single sweep. (ie the main beam crossed the target once) The benefit of lower ur bar and azimuth isn’t that this performance changes. Rather it’s that you get many more sweeps per second on the target. ie you get more chances to detect the target. Each sweep always being 10% (given the T-38 example). Said another way, you simply get to roll the dice more often. But the average performance remains the same. ED should instead use single scan probability of detection (not effected by azimuth/bar), rather than max cumulative. For instance, given the APG-66 / T-38 example above. Using single scan Pd, the T-38 would only be detected 1/10 sweeps at 20 Nmi. If ED used Max Cumulative, they'd simply make the detection 100% at 20 Nmi. I've made a fully open source/non-ITAR analysis of the APG-63 detailing the math behind all of this. ED should use the SNR figures provided to determine single scan Pd. Id recommend using a 0% Pd for anything lower than a 10% Pd, and a 100% Pd for anything above 95% Pd to simplify the code and because SNR figures get unreliable at these extremes. Note that my math/analysis has been cross checked against the APG-66 as well, with estimates nearly match Westinghouse themselves https://i.imgur.com/cVZSyQf.jpg Note that this graph is from IEEE, and has no government restrictions: "F-16 Pulse Doppler Radar (AN/APG-66) Performance" IEEE TRANSACTIONS ON AEROSPACE AND ELECTRONIC SYSTEMS VOL. AES-19, NO. I JANUARY 1983 APG-63-70 HPRF Basic Analysis.pdf
- 31 replies
-
- 30
-

-
-
I just wanted to show off a mod to my throttle. I added a potentiometer axis for antenna elevation (i imbedded a small secondary board into the unit for more axis/buttons) that I can switch between absolute value (F-16 Radar Elevation) or I can screw in a return to center on it for the F-18 and upcoming F-15E. null In total, my throttle modifications include: 2 new push buttons on the right throttle grip 2 new push buttons on the left throttle grip 1 new axis (antenna elevation) Optional return to center / absolute TM Warthog Slew mod Push through AB detent I must say that the return to center axis using a potentiometer (with really tight rubber bands) feels really good. Well worth the work. Hopefully this helps out some of you looking for a good solution for the upcoming F-15E, while still having it work for the F-16.
-
FYI, most mechanical radars can scan faster than they do during normal operation. However, scanning faster lowers your detection range by reducing your time on target (less pulses get integrated). I highly doubt the Captor-M actually scans at 333 degrees per second during RWS / TWS. Doing so would cut its detection range nearly in half. The benefit of this high scan rate capability (and AESAs) is 1. Less time lost in changing elevation bars and resetting of the raster scan 2. less time rotating the antenna face when in STT and during an aircraft roll 3. Track file revisits (main benefit of PESA and AESA). Which probably doesn't exist in the Captor-M in any mode except DTT. And this would only be during the motion between the targets. While on the targets (if performing a mini-raster) it would slow down again.
-
Game on Heatblur! (F-16) Lock (D).ogg