Search the Community
Showing results for tags 'thrust'.
Found 3 results
-
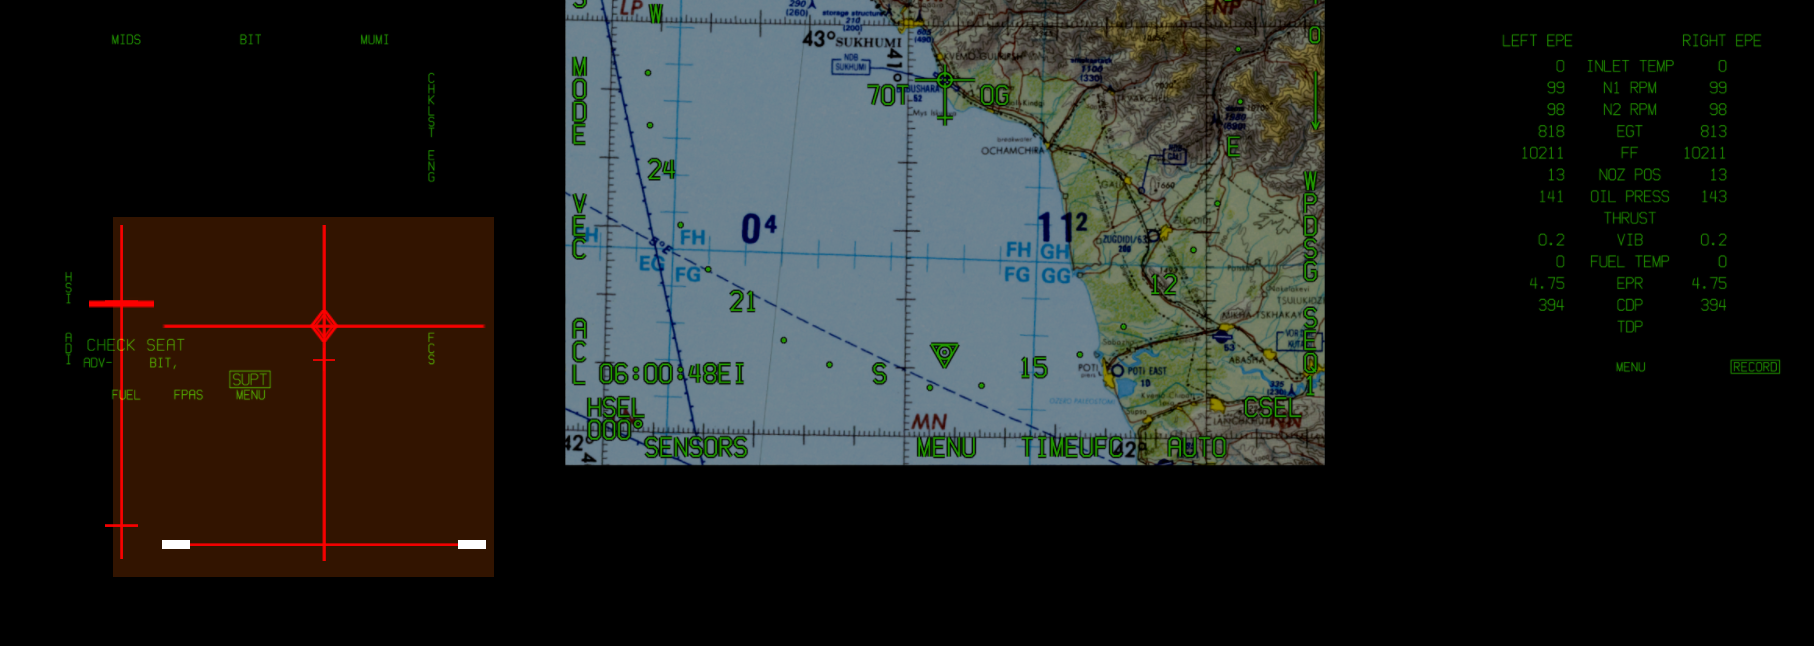
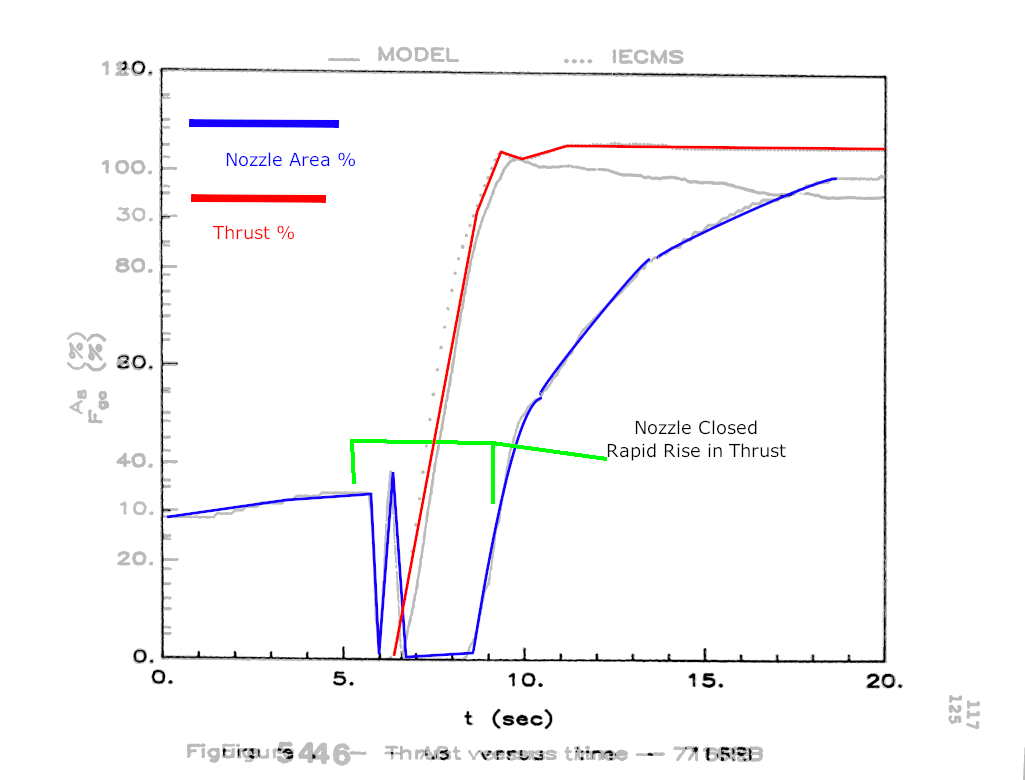
TLDR: two parameters of the engines, EGT, and nozzle area may be off, leading degraded transient performance. I think there may be 2 discrepancies with the F404 engines leading to marginal performance in the transient response of the engine. By which I mean the thrust output of the engine shortly after the throttle is moved. For now I will be discussing the response of the engine from Idle to Mil. The two issues are, 1, the EGT is too low and 2. The engine’s exit nozzle schedule may be off. First, the Exhaust Gas Temperature (EGT) on the engines looks low. The charts in the NFM-000, pages III-10-15, provide the operating EGT and RPM as function of temperature. The chart indicates, At full mil, with an inlet temp of zero celsius, the engine operates at 99% RPM with an EGT of between 830 c and 860 c. In game the EGT is ~ 815c, which is below the minimum operating condition. Low EGT is indicative of an engine that is under-performing and not putting out enough thrust. While the difference seems marginal. Low EGT can lead to a set of interconnected discrepancies. Which results in an underperforming engine. These interdependencies would exhibit themselves most strongly in the areas of transient response. IE The power output of the engine, while and shortly after the throttle is moved. Now on to the nozzle area issue. Which, maybe a case of the tail wagging the dog. In the F404, At full mill and above, the engine’s exit nozzle size (A8) is varied with temperature sensed aft of the low pressure turbine. (T5). Below Full mil the area is scheduled with the throttle position. When the throttle is moved to the full Mill position, the nozzles closes until the EGT limiter kicks on. https://www.sto.nato.int/publications/AGARD/AGARD-CP-448/AGARD-CP-448.pdf Page 64. https://asmedigitalcollection.asme.org/GT/proceedings-pdf/GT1990/79054/V002T02A035/2399309/v002t02a035-90-gt-357.pdf The result is a rapid rise in thrust. Below is engine data taken from a takeoff of CF-18 with 404-400’s. I’ve overlaid the nozzle position with time and the thrust with time charts. It shows the relationship between the thrust onset and the nozzle position. Note the rapid rise in thrust once the nozzle fully closes. Max thrust is reached ~ 3 seconds after the nozzle closes. The source is a Canadian paper on the development of computer model of the F404-400. https://curve.carleton.ca/c6dd200c-1bce-4711-9596-443f1cf85e70 In game, the only time I can get the nozzle position to 0 is when the throttle is 50% or lower. I know our Hornet has a different model engine, a 404-402. However, the 402 has higher thermal limits and therefore the nozzle position should stay closed even longer ~ 4 seconds when the throttle is moved to mil. If the nozzle position is too large during the transient, performance suffers. https://www.sto.nato.int/publications/AGARD/AGARD-CP-448/AGARD-CP-448.pdf Page 398. Since the resulting loss of performance tends to only show up in the transient response of the engine. It’s easy to miss the effect a misscheduled nozzle has on engine performance. NASA had the same problem with their dynamic engine model of the F404 https://www.nasa.gov/centers/dryden/pdf/88204main_H-1643.pdf Worse case scenario for the in game Hornet is that the combustor and or compressor isn’t operating properly and the nozzle is scheduled to far open. Or is the nozzle just too far open resulting in lower than optimum EGT’s? I suspect the latter, that the nozzle schedule is simply off. I can think of two reasons why this may have happened. First, there may have been a misinterpretation of the schedule. Most of the literature about the engine says, the nozzles are fully closed at “Intermediate Rated Power” IPR. Which seems like it would be 50% of the throttle lever range. However GE and NASA define IRP as full mill, 87° Power level angle. https://www.nasa.gov/centers/dryden/pdf/88068main_H-1375.pdf https://apps.dtic.mil/dtic/tr/fulltext/u2/a164562.pdf Since the nozzle area only seem to close to 0% at 50% throttle, it may be that it’s simply misscheduled, because the term intermediate rated power is confusing. The nozzle area may also be off because of how the game translates joystick position into throttle angle. This is related to where full mill is throttle range in game Vs IRL. In game full Mil is approximately 75% of the throttle position. In the real jet, Ground Idle, is 18°, Flight idle is 32°, full mil power is 87° and max power AB is 130° Power Lever Angle. So the throttle operates over 98° of PLA in flight and 112° of PLA at ground idle. At ground idle, if we want full mil the throttle lever should be moved 87° of throttle. This is ~ 77% (87/112) of the range of the real jet. In game full mil occurs at 75% throttle.So how does the game handle the scaling difference. It could be a source of mismatch, you may be taking off at below mil power. With the engine operating on a below optimal engine schedule. The same is also true while inflight. The throttle operates over 98° from 32° flight idle to 130° Max A/B, With full Mil power at 87°. Full mil in the real jet is at %88 of the throttle, while in game it’s at 75%. Depending on how the scaling is handled, with your joystick at 75% you may not actually be in AB yet. Which could make AB light times seem too long. Concluding, I think it would be a good idea to check the nozzle scheduling. If that’s correct, Then perhaps check how the joystick to throttle angle scaling is handled and see if there are any discrepancies. Then perhaps look at compressor and combstor engine performance. In order to find out if there is an issue with engine performance in transient response. enginerunup.trk

-
 All charts are sourced from SFI AJ 37 del 3, 1979 print. Test flights were flown in ISA, using weights as close as possible to those described for each loadout (remembering that the AJS is somewhat heavier than the AJ), either start weight or flight weight depending on what the chart in question described. LEVEL ACCELERATION Tests were run at 0km, 6km, and 11km in ISA conditions only. Each test included two runs (one by myself, one by Airhunter) with clean config/rent FPL. In addition, I ran a second set of 0km tests with a group 3 loadout (4x ARAK + XT), and 6km tests with a group 4 loadout (4x SB + XT). Two tests were run at 11km with the loadout stipulated in the manual, one by myself and one by Airhunter. Airhunter provided me with tacview files and graphs which I then charted against the manual (obviously only for the clean config 0km and 6km tests, and the 11km test). On my own end I forgot to save tacviews, but did save trackfiles, which are attached as well. The results show what I'd found myself: At sea level, mil thrust is maybe a touch slow to accelerate to M 0.9 but is still relatively close, and zone 3 is tuned almost on the dot. Zone 1 and 2 show discrepancies, particularly zone 1, although they aren't very large at this altitude. Excuse the rather unscientific graphs, but unfortunately just overlaying the ones from tacview wasn't really workable and I'm working with what I've got here: At 6km alt, mil thrust gradually diverges from the chart, ending up a little slower than expected. Zone 1 and 2 show large discrepancies. Zone 1 follows zone 2's curve, zone 2 follows zone 3's curve, and zone 3 is doing something else entirely. At 11km alt, only zone 3 was tested. The results were very far off the expectation: according to the chart, level acceleration from M 0.9 to M 1.6 should take about 5 minutes and 45 seconds. In the sim, this was achieved in just one minute (!), while acceleration from M 0.9 to M ~1.63 (as far as the line is drawn) should take about 7 minutes and 15 seconds, while in DCS it took 1 minute and 15 seconds. This is a very large discrepancy even compared to the aircraft's own charts, but also compared to acceleration profiles of other aircraft known to have phenomenal performance in this area (F-104, MiG-23, MiG-29). Something is clearly causing an issue here but I don't know what. Big thanks to Æck for spotting this one during a MP session and bringing it to light - I wouldn't have thought to test it otherwise. Finally for now, THRUST/DRAG EQUILIBRIUM SPEEDS AT SEA LEVEL This has been something I've been meaning to report for a while, but invariably by the time I got trackfiles, DCS would update and break them. As a result I'll just post the results of my testing now and drum up the trackfiles when I get time. Please note that this is separate to, but was compounded by, the now-fixed drag issues with Sidewinder launch rails. Each test was run using the circled loadout group from the AJ 37 loadout tables - so rent FPL was clean, group 1 was KA-24-XT-24-KB, group 2 was KA-24-XT-blank-04, group 3 was RA-RA-XT-RA-RA, group 4 was SB-SB-XT-SB-SB. All loadouts except group 4 (bombs) reach thrust/drag equilibrium above the intercept of MAX ZON 3 lines and thrust/drag lines, some significantly so. Group 4 is slightly slower than expected, the clean airframe flies beyond even SAAB's estimate for a world speed record using a stripped and polished modified aircraft, groups 1 and 2 are beyond the aircraft's Vne and fall off the chart, and group 3 (which should be the slowest according to the chart - just barely subsonic, likely due to the rocket pods generating enormous amounts of transonic drag compared to anything else tested) is sitting slightly above the aircraft's Vne. It seems drag values need looking at. I don't have trackfiles handy for these tests (the ones I did have are now several DCS patches old), but I do have tacviews for them. I can get tracks again if necessary. I haven't checked climb performance yet, but hopefully there won't be anything to add for that. OWN TRACKFILES.zip Tacviews from Airhunter.zip drag tests.zip
- 23 replies
-
- 21
-

-

-
- drag
- flight model
- (and 4 more)
-
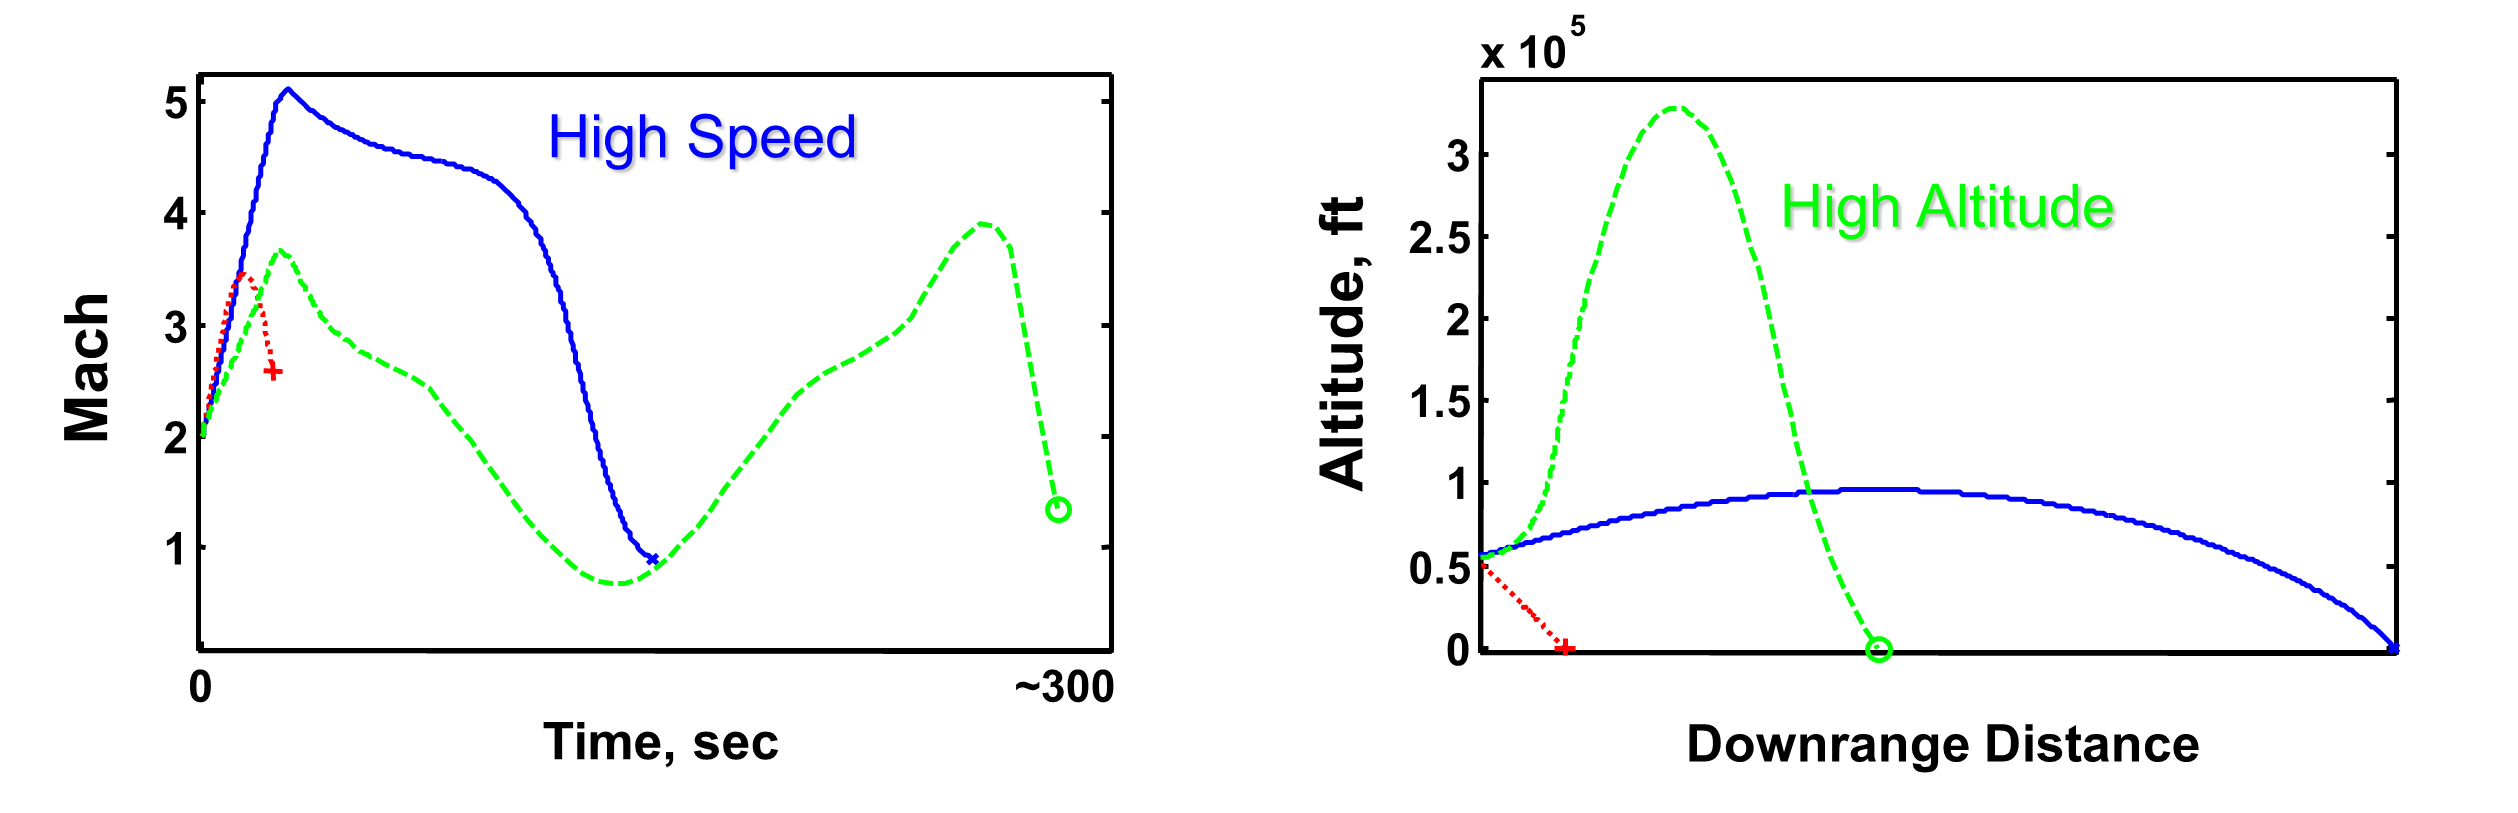
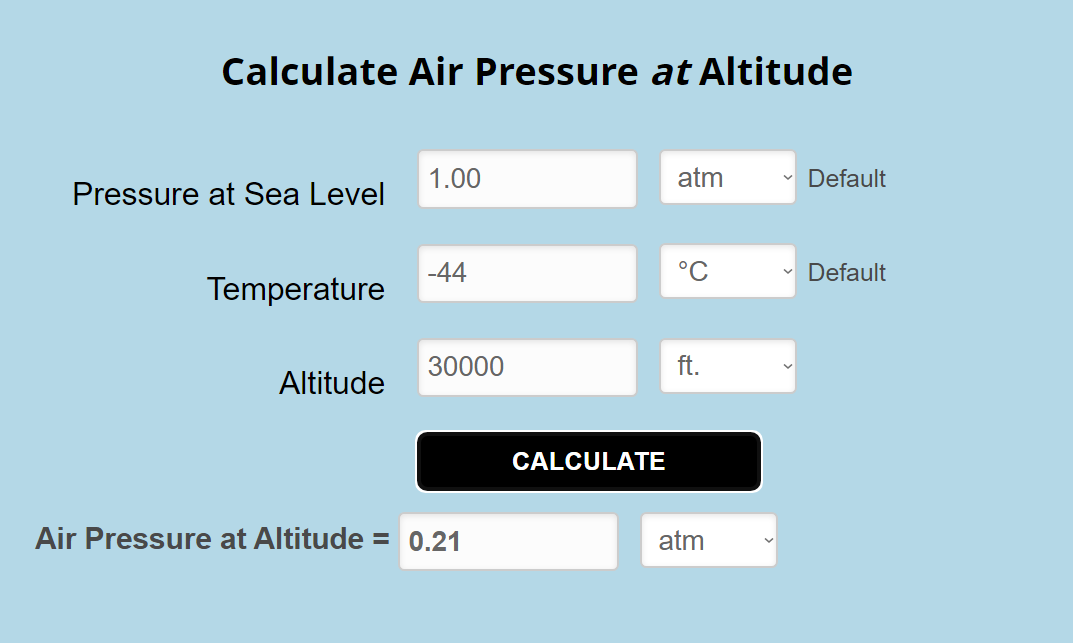
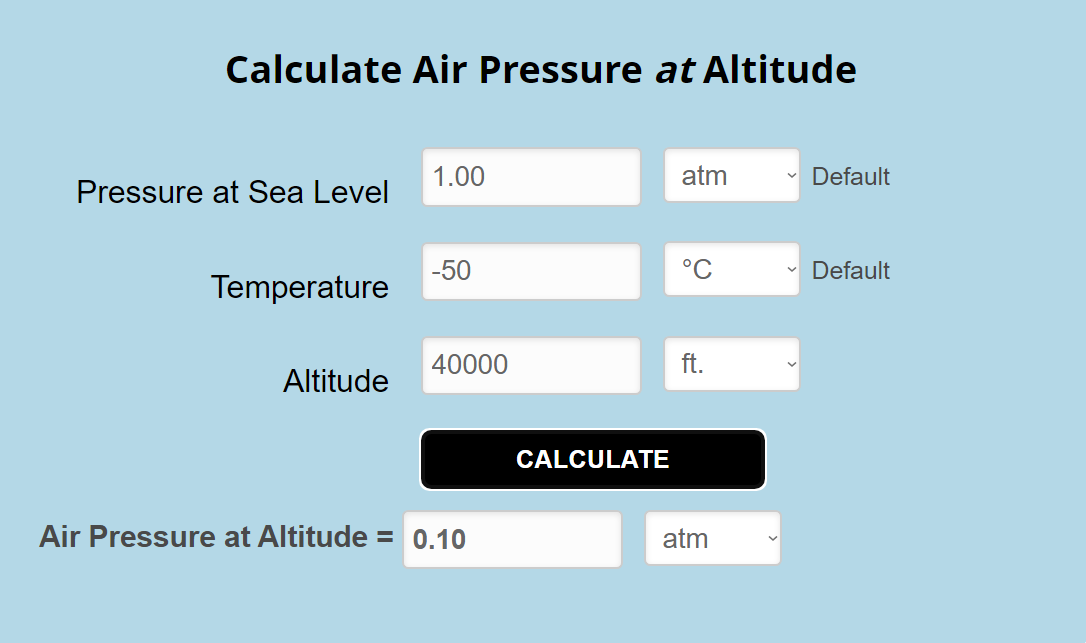
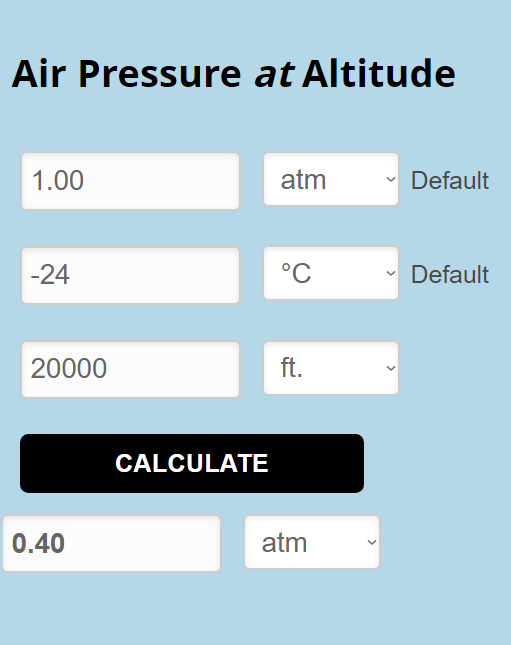
 Specific Impulse is calculated like this: https://www.grc.nasa.gov/www/k-12/airplane/specimp.html It will be called "Isp" from here on. The Isp therefore calculates from Game Files like this: 13595N / ((163kg/27s) * 9,81m/s )= 229,554s As a Comparison, the Space Shuttles Solid Rocket Boosters Isp was 242s on Ground level, 268s in Vacuum. Source: https://en.wikipedia.org/wiki/Space_Shuttle_Solid_Rocket_Booster?fbclid=IwAR0U76UEI_XSu9uyMmW-ieV7sorH4y-cTmtCPLeXGUVowO2t_1LMh3T8ii4#:~:text=This propellant is commonly referred,%2Fs As visible in the Files, it currently works with a specific thrust that is not changing with Air Pressure, even tho it should. Source: https://www1.grc.nasa.gov/beginners-guide-to-aeronautics/thrust-force/#general-thrust-equation-for-rocket-engines Furthermore, the Missile does currently NOT reach close to its Specification, as specified in the two Sources below (see "New Air-Launched Small Missile (ALSM) Flight Testbed forHypersonic Systems" and "SubA_6_2_Phoenix Project Overview"). Source: "nullNew Air-Launched Small Missile (ALSM) Flight Testbed for Hypersonic Systems" Source: "SubA_6_2_Phoenix Project Overview" Furthermore, both Rocket Motors share the same Isp, even tho one is Smokeless and the other one is Smoking (!!!) This is very unlikely, given smokeless propellants usually have Isp Drawbacks. Proposed Solution: Currently, the Aim-54 Isp and Max. Mach Speed are too low compared to the real world without a doubt. Increasing the Thrust (and therefore Isp) by: 5% for the MK60 Motor at Ground level 0% for the MK47 Motor at Ground level would put the MK60 Motor at 241,03s of Isp, about on par with the Space Shuttles Solid Boosters. Most important however is the (currently missing) additional Dynamic Thrust by Altitude: Both Boosters should gain extra Thrust of 268s/242s = ~11% when in Vacuum, so using the Barometric Formula for Air Density at Altitude both Motors should achieve a higher thrust of: 3,74% burning at 10000 feet (see Math below) 6,6% burning at 20000 feet (see Math below) 8,69% burning at 30000 feet (see Math below) 9,9% burning at 40000 feet (see Math below) Math: 10000 feet: 1atm - 0.66atm = 0.34atm, 0.34 * 11% = 3,74% 20000 feet: 1atm - 0.40atm = 0.60atm, 0.6 * 11% = 6,6% 30000 feet: 1atm - 0.21atm = 0.79atm, 0.79 * 11% = 8,69% 40000 feet: 1atm - 0.10atm = 0.90atm, 0.9 * 11% = 9,9% Source: https://www.mide.com/air-pressure-at-altitude-calculator & https://en.wikipedia.org/wiki/Barometric_formula For Testing, I have modified my Game Files to match the Math: The MK60 Missile would now reach Mach 4.5 instead of its previous Mach 3.8 when launched at 40000 feet, bringing it right to where it should be, according to both Sources ("New Air-Launched Small Missile (ALSM) Flight Testbed forHypersonic Systems" and "SubA_6_2_Phoenix Project Overview"). Thank you for taking the time to read and assess this, Dear Reader Best Wishes, Florian (Student and future Engineer of the Aerospace Engineering Branch) New Air-Launched Small Missile (ALSM) Flight Testbed forHypersonic Systems.pdf SubA_6_2_Phoenix Project Overview.ppt