
_picon
-
Posts
20 -
Joined
-
Last visited
-
To repro: Use latest, DCS 2.9.20.15010 from 17.09.2025 Start "Free Flight" mission in the Hornet. Look to the side. Find some linear artifact. Video is attached. dcs.log is attached. Full screen viewing would be needed, look at the cursor. Digital Combat Simulator 2025-09-19 08-02-44.mp4 dcs.log
-
- 1
-

-
I think the thread went a bitoff track, given the information provided in the description (and afterwards). In particular with regards to memory consumption not being an issue at play _for this particular case_ . I don't doubt that other stutters and small freezes are related to that. However, I'm happy to report that I no longer have these particular freezes after the update to DCS 2.9.20.15010 - 17.09.2025 for whatever reason... Confirmed by reverting back to previous version (still reproduces the freeze), then updated to latest again (no freeze). That said, I can still provide an ETL trace for analysis if needed.
-
The image of the log covers "start of mission", includes one freeze, and after that I stopped recording. Not exactly from the same run as the video, but a similar one. (the full log (that is, not just the screenshot) is much more than 50MB) I did try to not park the cores (changing power profiles etc), but since that didn't change the behavior, I switched back. Right, I do suspect Win 11 would do better scheduling betwen P and E cores for general performance goodness. (right now I have trouble upgrading, but that is a totally different story!) And indeed, the issues reproduces even at low settings. VRAM usage is ~5.7GB (out of 12).
-
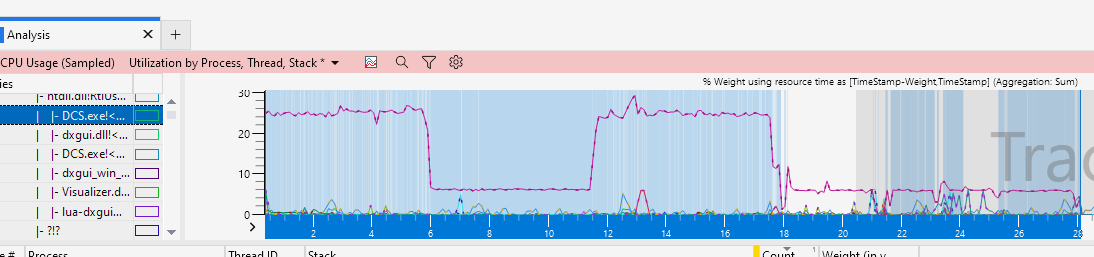
Not exactly the same problem as the others that reported the ModelTimeQuantizer: ANTIFREEZE ENABLED issue, it sounds like. These are not some temporary stutters, these are 5-15 second long stops. Outside the freezes, it is theoretically 200fps-ish (for that particular flight that I'm using as an example). Confirmed that the issue reproduces even at Low graphics settings. Also, increasing RAM to 96GB does not change the repro. nullImage of CPU usage during the freeze. Confirmed that during the freeze, almost all threads are idle. The only really threads active is one that calls into Visualizer.dll, and another that looks like the sound thread. Almost no other threads are active during the freeze period

-
Even with a larger page size, still the same issue. Also, changed the power settings to best performance (ie, no parked cores) Not sure if relevant, but I do get this message in the log around the time the freeze happens: "2025-09-06 12:17:41.781 WARNING WORLD (Main): ModelTimeQuantizer: ANTIFREEZE ENABLED" I would expect that the explanation be somewhat straightforward by looking at the ETL file (and see the stack traces) by someone who has access to symbols (that is, not me :-))
-
It is indeed excluded. In fact, during the freeze period, DCS CPU usage goes way down
-
dcs.log Digital Combat Simulator 2025-09-05 10-19-19.mp4 I'm experiencing some fairly hard freezes while playing DCS, rendering it unusable. Attaching a video, and DCS log (but not from the same run). It is not limited to the Hornet module, it seems. It is only DCS that freezes, while DCS is frozen, sound is happening, and I'm also able to alt-tab to another application. I did try removing all the plugins mentioned in .../Saved Gamex/DCS/Export.lua, no difference. If needed, I can share an ETL file (captured with gpuview/xperf), but it is a bit too big to go here. Other ideas welcome. Unfortunately, I don't really know when this started (haven't played for a while)
-
When it works, nsight graphics. https://developer.nvidia.com/nsight-graphics . But I've found that attaching isn't always working (no clue to why though).
-
fixed GPU performance improvement suggestion: redundant clear UAVs
_picon replied to _picon's topic in Game Performance Bugs
No, I haven't really looked into it much to be honest, as I was able to utilize nsight (with the crash reporting option turned off). -
Not really, but I have played around with the cascade distances to improve the quality of in cockpit shadows. (essentially, adjust the range to use the highest resolution cascade, to "just" be inside the cockpit (like 1 meter or so), instead of something longer). But that is kind of orthogonal to the issue at hand.
-
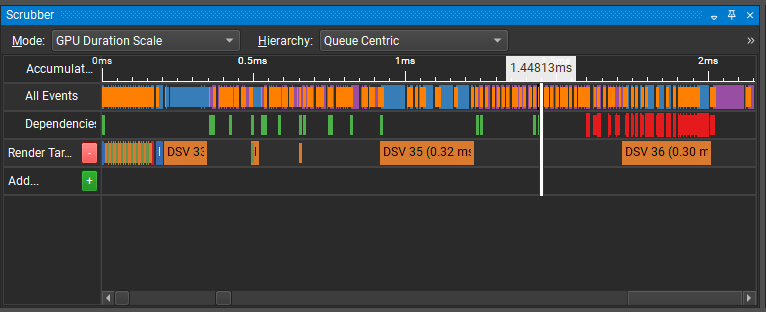
Hi, This may be a too big of a change, given that Vulkan behaves quite differently in this area. (and/or that this wouldn't be applicable at all when doing ray traced shadows). This is partly speculation on my side here as well, since I can't know in detail what is going on. What we are looking at here is a screenshot of the timing of the shadow rendering. From what I can tell, DCS is using a cascaded shadow map technique, which has 4 shadow maps. (and during rendering we seem to choose one, but we do see some artifacts at boundaries here and there). The rendering (closest focus is done first) is done in the DSV boxes below. But between this rendering, there is a whole bunch of compute dispatches, that don't run in parallel (since they update the same UAV). The results is that these compute dispatches are not using the full width of the GPU (ie, doesn't scale with GPU size), and are therefore very inefficient. Would it be possible to either use the existing vendor extensions (if the dispatches don't write to the same locations)? https://docs.nvidia.com/gameworks/content/gameworkslibrary/coresdk/nvapi/group__dx.html#gaeb78a97e256f3c6c511451dded3994e5 https://gpuopen-librariesandsdks.github.io/ags/group__dx11_u_a_v_overlap.html Or, alternatively, at the potential use of additional vidmem, use different UAVs for the different shadowmaps, and launch the dispatches in an interleaved fashion? (ie, launch a dispatch for shadow map 0, then for shadow map 1, etc). The idea being that each set of 4 dispatches would then run in parallel, instead of just a single one). Perhaps even draw all the shadows in a single pass using multiple views. Given that the shadow map rendering doesn't scale with screen resolution, this reduces the goodness we see from DLSS/FSR.
-
fixed GPU performance improvement suggestion: redundant clear UAVs
_picon replied to _picon's topic in Game Performance Bugs
Thanks, will take a look. I've currently having issues with RenderDoc (doesn't attach to the app properly, no API detected) -
fixed GPU performance improvement suggestion: redundant clear UAVs
_picon replied to _picon's topic in Game Performance Bugs
Thanks. Perhaps it makes sense to just confirm the same thing doesn't pop up in the new Vulkan based engine. -
fixed GPU performance improvement suggestion: redundant clear UAVs
_picon replied to _picon's topic in Game Performance Bugs
Looks like this inefficiency is still there in 2.9. -
fixed GPU performance improvement suggestion: redundant clear UAVs
_picon replied to _picon's topic in Game Performance Bugs
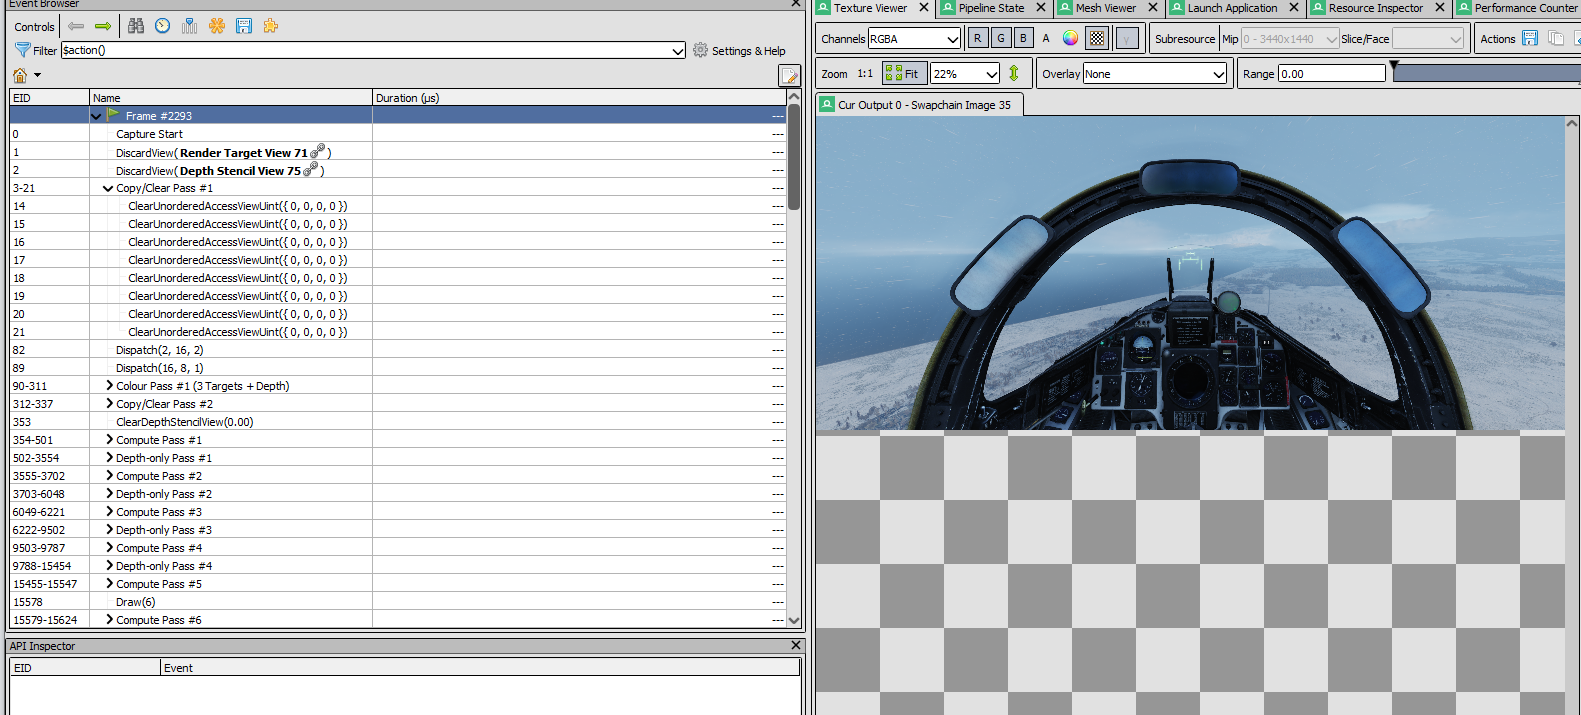
I can provide more details if needed, like the entire capture (but it is fairly big!), but this a screenshot of my capture. The "Copy/Clear Pass #1" (expanded) contains a number of ClearUnorderedAccessViewUint calls. If one looks at the resources involved, most are cleared twice, with the same data. (while one is at it, it might be worth looking into if it is necessary to do the clears at all, or if the data is totally overwritten later by compute shaders)