
.png.02f118ecebd8335f0767729a49c3d717.png)
Pixy67
-
Posts
31 -
Joined
-
Last visited
Content Type
Profiles
Forums
Events
Posts posted by Pixy67
-
-
can we have Jeff?
-
 1
1
-
-
Free D4n
-
1
-
-
TPOD vs TGP
in F-15E
On 8/10/2023 at 10:43 AM, Ignition said:The problem is the LITENING of DCS. It has a lot of resolution, you can see which target is which from more than 20nm.
Also the WMD-7 from the JF17 is a SUPER TGP with ultra high resolution.
Superior Chinese tech
-
TPOD vs TGP
in F-15E
Ray Charles can see better than the Lantirn Pod
-
11
-
-
This just happened to me too. I wasn't using the laser for very long and it burned out before I could finish my sortie. Once thing I did differently was I changed the laser codes for both the pylons and the TGP instead of using the default 1688 code. I've never burned out the laser using the default laser code so it could have something to do with it.
-
I've been having this issue too. I'm looking straight at the opponent from rear aspect and getting no tone
-
I was able to reach Mach 2.3 at 48,000 feet. Part of the right wing broke and caught fire when I hit Mach 2.3, that must be the structural limit.
-
1
-
-
12 minutes ago, Tim_Fragmagnet said:
I'm going to open with this, I am not looking for perfection, I am merely looking for "Good enough".
Additionally, this is about the PERFORMANCE, model, not the flight model.
This is about making the engine use the correct amount of power and fuel for any specific flight profile.So, profiling the huey. Where to begin.
Well I feel it prudent to start with the torque calibration factor once again. This isn't something you can profile, but understanding what it is allows you to understand the potential flaws in the current method of profiling.So, what is the torque calibration factor. As simple as possible, this is the value the torque gauge reads while the engine is putting out 1125ft-lbs of torque. So why is it important? The Torque Calibration factor is important because ED has not provided one for our huey, and it is effectively impossible to determine as a client.
Therefore, we will assume a calibration factor of 61.4. As shown by the calibration factor chart, this provides a 1:1 representation of indicated to calibrated torque, what you see is what you get. 50psi, is 50psi.

It is, however, still important to understand the implications of doing this. If our huey were tuned for a calibration factor of say, 66, our torque gauge at a reading of 50, would actually be corrected to a torque of around 43, a difference of 7psi. Conversely at a calibration factor of 54, 50psi indicated would instead actually be a real torque of well over 50psi.
However, as per the graph, this error gets lower and lower as the indicated PSI gets lower and lower. This means that to correct for an anomalous calibration factor, you cannot simply just shift the entire graph up or down. It would need to be adjusted for each datapoint. Additionally, note that the correction is always in one direction, if your calibration factor is above 61.4, your indicated PSI ALWAYS reads high, if your calibration factor is below 61.4, your indicated PSI ALWAYS reads low, it doesn't change throughout the range of torque.However, all data for the real huey is presented in calibrated torque. So if we assume our huey has a calibration factor of 61.4, this would mean that the graphs generated through empirical tests should match up nearly identically with the real thing.
So.
Where do we begin?
First, here is the test mission.
Huey Test 15C 29.92inHg.miz
Lets start with the static tests.Let's start with the fuel test, the goal here is to profile how much fuel the engine uses for any specific volume of power usage.
The method is actually fairly simple.
First, use the cargo trigger included in that mission file to add 10,000 weight (it's in kg) to the huey. This will prevent our aircraft from moving during this test.
Next, with the aircraft hotstarted on the ground, we raise the collective until we reach the desired volume of power (torque) we wish to test at. Then we time how long it takes for the engine to run out of fuel, you can use the F2 menu's time for this as the huey's clock isn't entirely accurate.
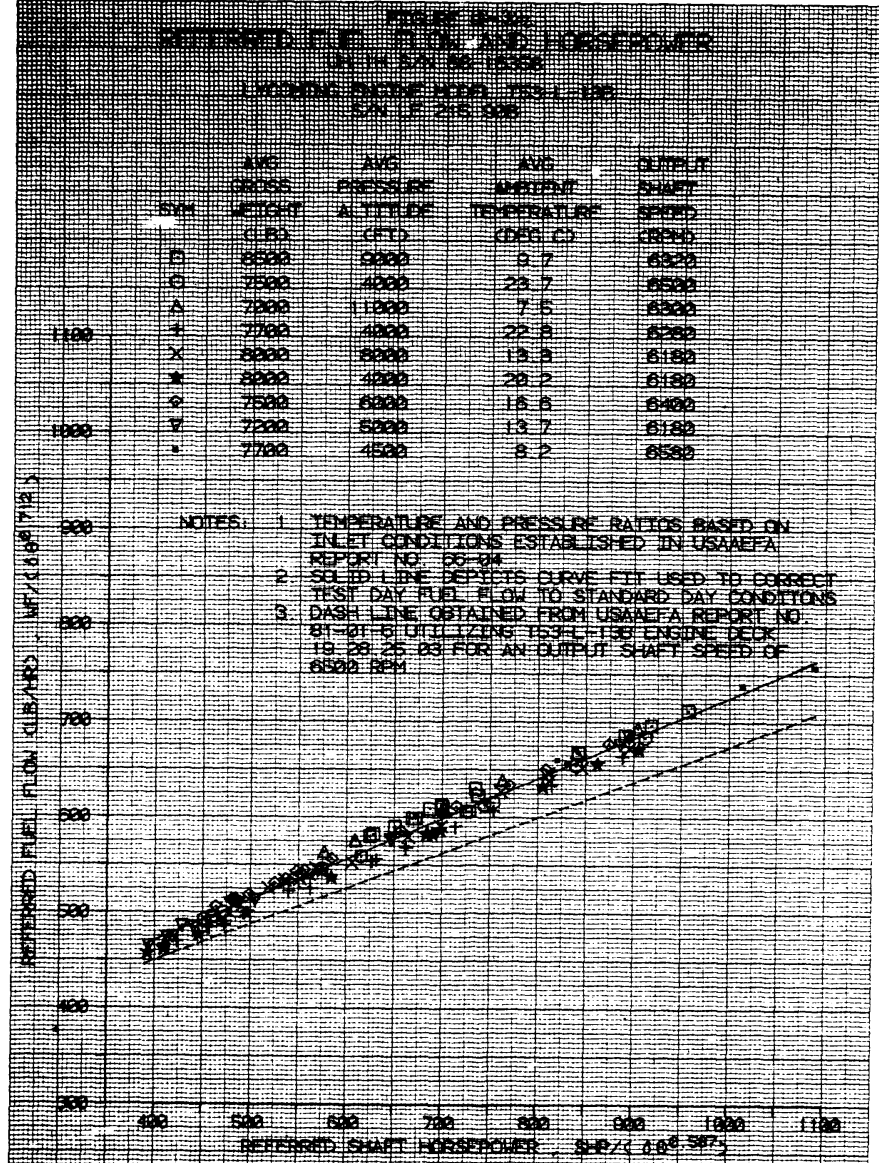
Then we repeat for multiple different volumes of power.With our data gathered, we must process it so it is usable on our reference graph.
We must provide fuel use in pounds per hour in relation to the amount of specific shaft horsepower used.
We have the time it takes to drain all the fuel in minutes
We have the indicated torque required to drain the fuel in this timeStarting with turning the fuel to lbs/hour, that's actually fairly simple.
60/time in minutes, then multiplied by the total fuel load drained (max fuel is 1391lbs, max fuel will provide the most accurate data)
So (60/170)*1391=490.94lbs/hour
Now we will turn torque in to shaft horsepower.
Take the Torque in PSI and the Rotor RPM, and process those 2 pieces of data through this formula.3.88*((10^-3*ROTOR RPM)*((17.76*PSI)+33.33))=Total Shaft Horsepower
Now that we have processed the data, we can plot it on the graph.
Do note, that formula is only for the UH-1H.
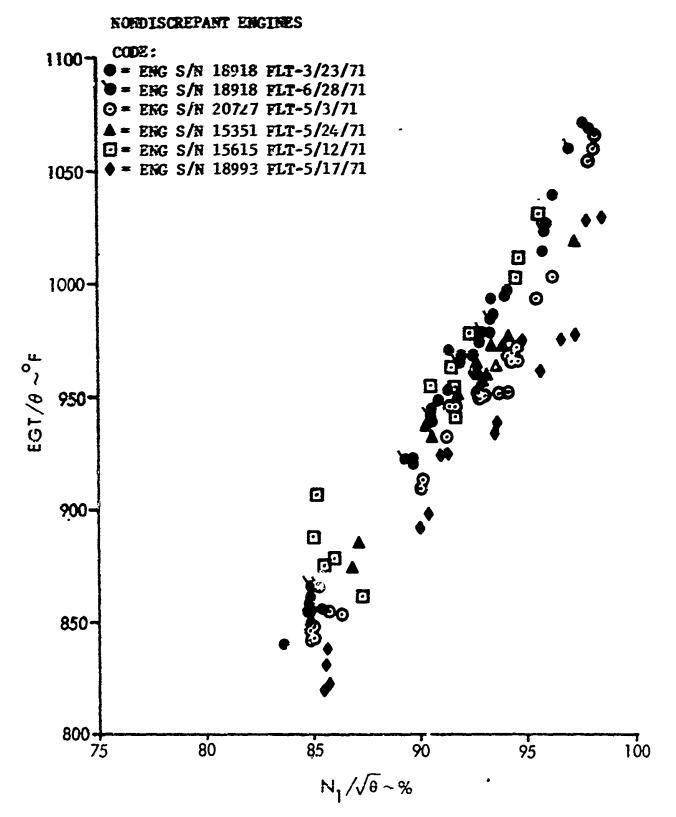
So, the next static test is the power/throttle profile, which can additionally be used to chart EGT data as well.This involves checking how much power is provided for any specific volume of N1 on the N1% gauge.
Since you now already know how to turn torque and rotor RPM into shaft horsepower, this is simple.Using the stationary huey, measure at torque values specifically marked on the torque gauge (20,25,30,35,etc) and then observe the N1% on the gas producer gauge. (this is more accurate than the other way around.)
While you are doing this, gather EGT data as well for each point you measure.Convert the torque to shaft horsepower, and then plot the data on this graph.
Then using the EGT data you also gathered during this test, plot it on this graph.
Do note that this graph is in Fahrenheit so you have to convert C to F.
So, those are the tests that can be done without moving the aircraft.Up next are the flight tests, we'll start with hover tests.
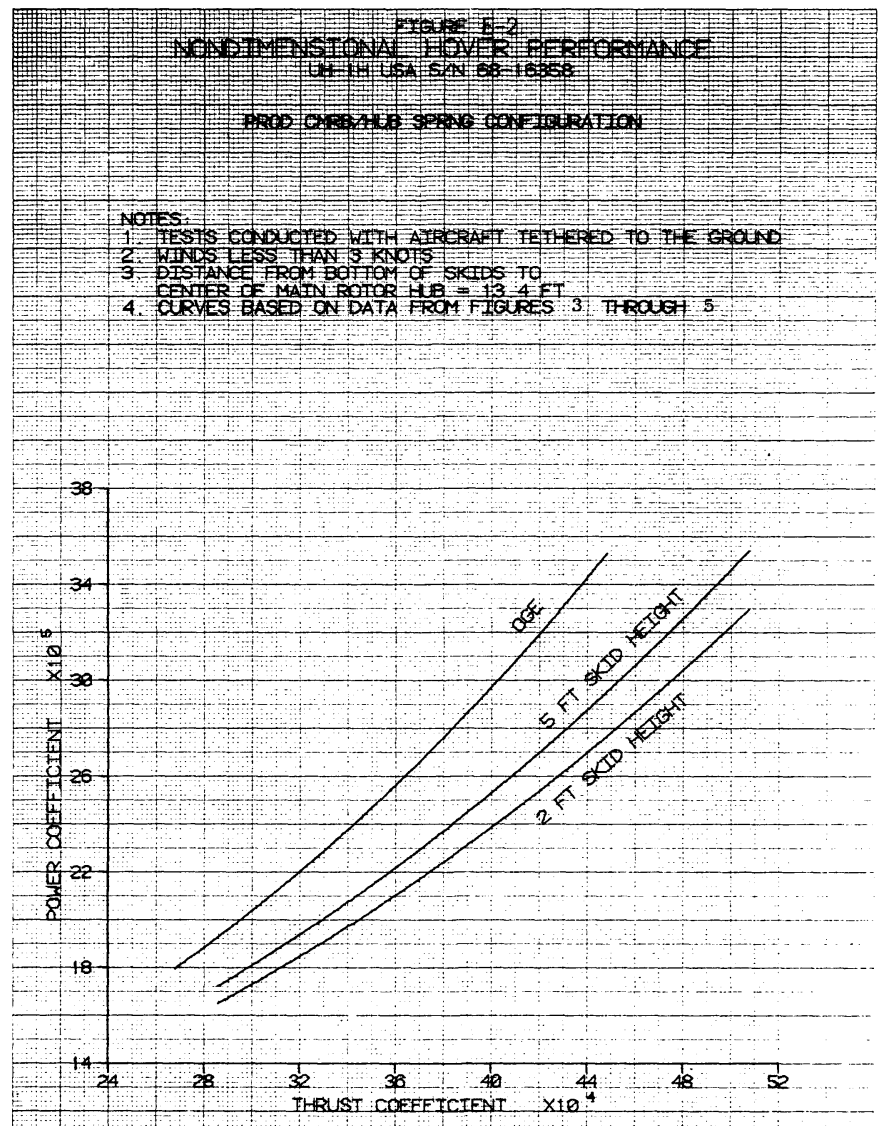
I will refer to the first post for a more detailed description of the hover test and will simplify it here.Simply put the aircraft into a hover at several different weights, and at heights of 2ft,5ft, and out of ground effect (over 60ft but ideally less than 100ft), and record the torque required at each point.
Process the data with these formulas. (you can obtain the shaft horsepower from the earlier formula to convert torque into shp)
Power Coefficient = ((SHAFT HORSEPOWER*550)/((0.02289013*PRESSURE INHG/(TEMPERATURE C +273.15))*1809.56*(((ROTOR RPM*2π)/60)*24)^3))*10^5
Thrust Coefficient = (TOTAL THRUST [gross weight for this test] IN LBS/((0.02289013*PRESSURE INHG/(TEMPERATURE C +273.15))*1809.56*(((ROTOR RPM*2π)/60)*24)^2))*10^4
And then graph the processed data on this graph.
With the hover data completed we move onto forward flight.
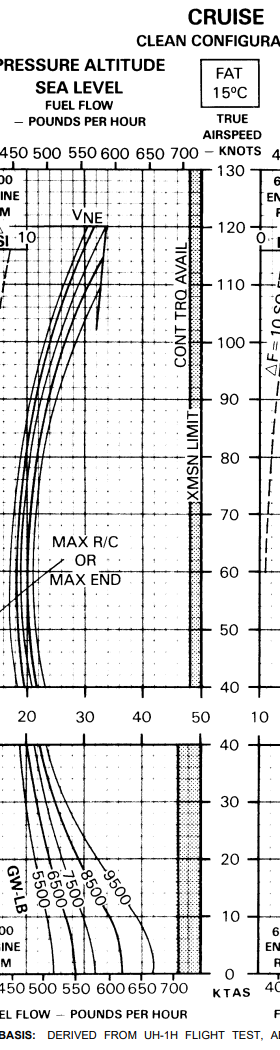
I have thrust coefficient graphs for the huey in forward flight, however they are unusable by us as clients for reasons stated in the previous post. So we will use the torque chart presented to us in the huey's operator's manual.
Specifically the sea level one, because if this one isn't correct, that means the baseline performance isn't correct to begin with.
We will also no longer be correcting for the 2 square ft of drag added by the IR suppressor, as not only does it not affect the flight model in any way other than weight right now anyway, we should profile the base, unmodified performance of our variant of the huey, in the same configuration it was profiled in for our data.
To do so is fairly simple.
In the F2 view during gameplay you are provided with a status bar at the bottom of your screen, within this bar is a measurement of your speed. By default it is set in IAS, however if you press CTRL+T it should toggle it to TAS unless you have rebound this.
All flight tests are measured in TRUE airspeed. Not indicated. Using the F2 meanue provides the actual TAS of the aircraft before any speed gauge inaccuracies are modeled.Simply fly the aircraft at a bunch of different speeds and weights and record the torque for each condition.
Ideally you don't fly to a specific speed, instead you fly to a specific torque, as the torque gauge is harder to read, so using its marked points allows for more accurate data collection.Multiple sets of data for the same condition can be done by restarting the flight and doing it again. This can help remove any outliers in the dataset.
Do not forget to use the unlimited fuel setting to prevent the data from being skewed by the reduction in weight from the fuel consumption during flight.
Additionally, do not forget to make sure the mission is not overriding the unlimited fuel setting, thus making your aircraft consume fuel regardless, without your knowledge of it doing so.
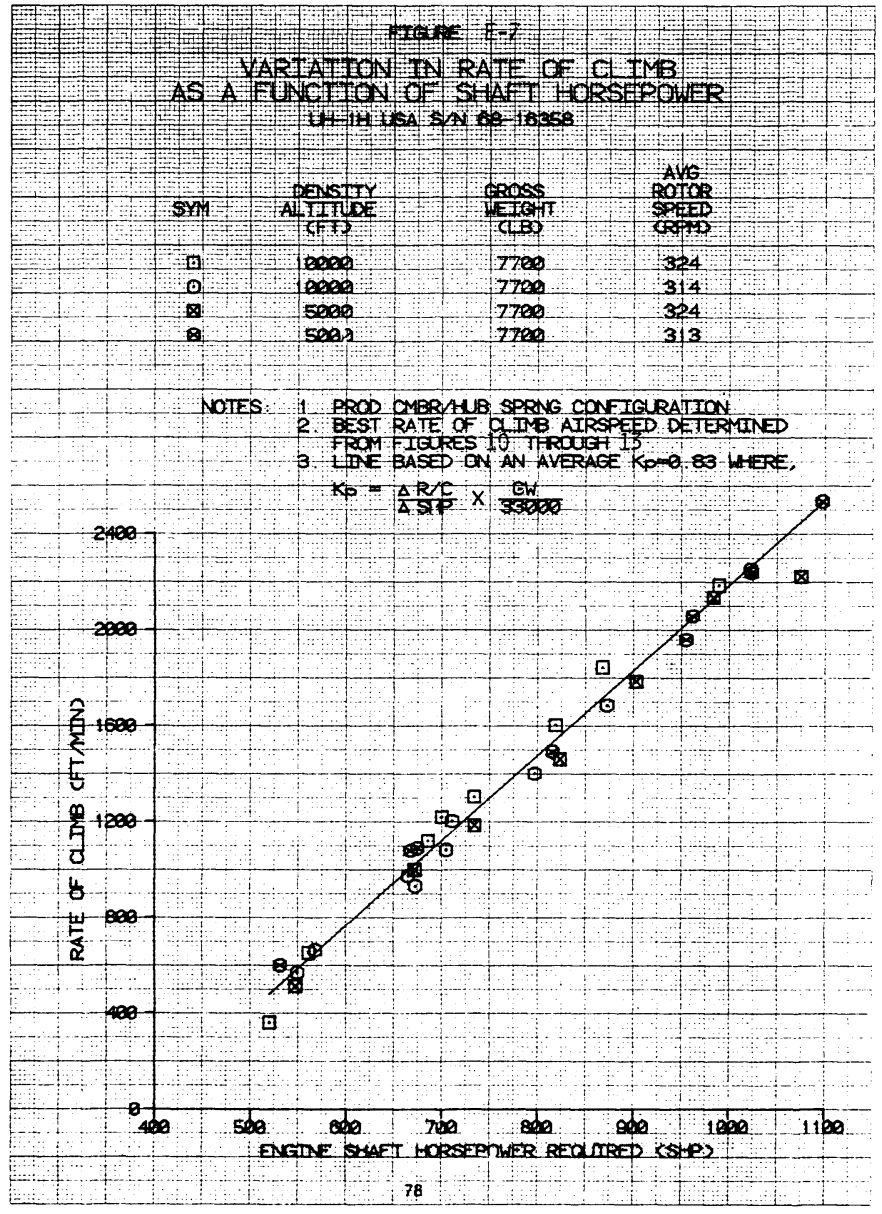
Up next, the rate of climb data.This is obtained by flying at 55-60knots TAS at different power settings (torque) at a specified weight (7700lbs for this test), and then noting your rate of climb.
Interestingly, the data shows a minimum reduction in rate of climb at different altitudes, so it shouldn't matter up to 10,000ft
If you want to one up me in this area, record multiple sets of the data for different altitudes. Just remember to keep adjusting your flight to maintain your speed and torque.
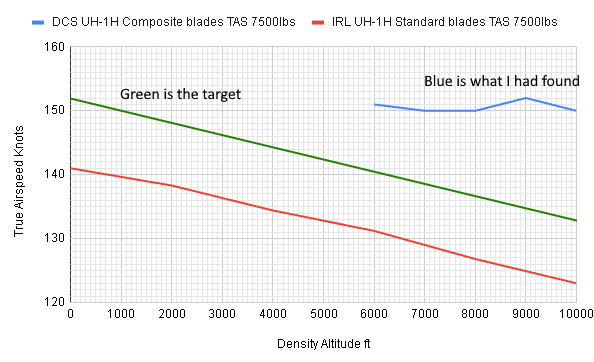
Up next is the max power speed per altitude data.
While I could provide the data to derive the graph for this test, it's tedious and annoying, so I recommend just using the one I have already made. (it involves taking many tables of data and interpolating it)The test is simple. At 7500lbs, fly as fast as you physically can in level flight at different altitudes. Ignore all restrictions, egt limits, torque limits, Vne, all of them. Crank the collective and go. If you can't keep the nose down, lower the collective, and flag that datapoint.
Here is the graph.
So where do we go from here?
Well for now, I'm sure you have enough to think about.
However I have some things to think about and process for myself
The data is probably for another thread.But it does make me smile.
Until next time, keep that mind sharp.I know, right?
-
Neither the stick deflection limiter or the aileron deflection limiter are real buttons but are meant to simulate putting about 20 pounds of pressure on the stick, yanking it back or to the side. I am assuming this is meant to help fly the aircraft better without small inputs on a PC HOTAS accidently being read as large inputs, which could easily trigger high AOA or over G. For some it could make it more difficult as it limits inputs. I think the option of yanking on the stick should be simulated by just yanking on the stick even if we don't need to put 20 pounds of pressure on our PC HOTAS. I'm hoping we can have the option of the deflection limiter binds in inhibiting the aircraft performance be optional.
-
2
-
-
I strongly agree with this, it would save a lot of time in mission making by no longer having to create FARP and airbase layouts in every mission
-
3
-
-
It was in level flight.
Someone mentioned I Should delete my old flight plans, ill see if that helps. I'll see if I can dig out the log file when I get home.
I don't want to give up on the Viggen just yet, but its been a long time since I've been able to fly it without any major issues.
-
I dont have a log file, but I remember it happened right after I fired two RB-04's
-
Viggen still crashes me to desktop
-
Are the rest of the missions going to be like this? the map is too small to have these kind of missions. A fully loaded FW-190A8 takes forever to climb to 7000 meters and it takes even longer to set a head on pass or dive on the bombers. I only have time for maybe 1 pass at the bombers before they disappear if I wait for the P-47 escorts to turn back.
It wasnt an issue in the Jagdfleiger campaign, which I really enjoyed, since the map was bigger and the Bf-109K4 climbs so well.
-
I'm also having this problem, have crashed to desktop 3 times the last couple days while flying the Viggen. Am unable to finish a sortie, Viggen module is currently unplayable for me
-
After cutscene ends jettison tank, split S down to build up Energy. Use the Energy to gain nose position by coming back up on their 6 low. They should then be easy picking for missile shots at that altitude
-
1
-
-
On 2/18/2021 at 9:06 PM, FrankMT said:
Verified the bugs to be true, trying to figure out why now. We will fix it and release a hotfix file of M12 later. Sorry about the inconvinience.
It's fine, its not much of an inconvenience since its on the last mission. The rest of the campaign seems to be working well and is playable.
-
-
AI flankers now attack before the the cutscene ends and before they turn from friendly to hostile.
-
On 2/17/2021 at 7:20 PM, JG54_NF2 said:
In the latest ob update, I slightly adjusted the AI behavior of the enemy aircraft in the M12. They will have a more logical response. You can try or challenge again.

Can you change it back? All AI flankers are attacking immediately, before they switch from friendly to hostile and before the cutscene is even over. Mission 12 is now bugged and unplayable
-
Pixy67 - JF-17
-
Super Hornet fits all the hints made by ED (Boeing aircraft, modern but not too modern, multicrew with F-18F variant, BLUEFOR). Matt Wagner is also probably very familiar with it after working on Janes F-18
-
I'm pretty sure its going to be the Super Hornet
-
name: Pixy67
squadron: VFA 45


my single missions are not loading ships and ground units after today's update from steam
in Mission Editor Bugs
Posted
I was also having this problem with the Su-30 mod installed, had to remove it