
Crumpp
-
Posts
1593 -
Joined
-
Last visited
-
Days Won
3
Content Type
Profiles
Forums
Events
Everything posted by Crumpp
-
The stability and control modeling in DCS is very well done. The FM developer pays a lot of attention to the behaviors using measured data. I would think setting up a curve serves to destroy the "personality", advantages, and disadvantages of these behaviors. You might very well mitigate one behavior and exaggerate another.
-
Here is David's presentation to the AIAA. He does a nice round up of all the aeronautical research on the design. AIAA913288.pdf
-
Sure can... The point is the math shows the airplanes to be very even dogfighters no matter which method is used to determine that performance.
-
Laminar flow airfoils are very misunderstood subject when it comes to airfoils and flight sims. Laminar flow is a high speed/cruise range event. It is not a high angle of attack occurrence. For the readers...the red box is the drag bucket. Notice the Coefficient of Lift it corresponds too. Now Laminar flow is very sensitive to fit and finish. One of the aircraft at work even as "bug scale" the mechanics have to use to count the smashed bugs on the LE of the wing. If it has too many, they have to be removed. Even then, the plane will fly fine, it just won't get the benefits of laminar flow in cruise flight. Did I give you a copy of David Lednicers Computational Flow analysis of the P-51? AIAA-2009-623-922.pdf

-
I hope we have a system that requires you to do this: http://www.skybrary.aero/index.php/Visual_Scanning_Technique And not one that lets you do this like previous games in the past until DCS came along.
-
Interesting conclusions! I hope you model the characteristics of the NACA 23015 at high alt / mach. The FW-190 was not a high altitude fighter, even with a better engine. http://www.wwiiaircraftperformance.org/fw190/Fw_190_Dive.pdf http://www.wwiiaircraftperformance.org/fw190/fw190-0022-dive.html See how the aircraft is porpoising at 9000 meters: http://www.wwiiaircraftperformance.org/fw190/Fw_190_0022-Dive-2.jpg Notice the high mach stall of the F6F.... The FW-190 seems to be very similar.
-
Got it.
-
Or the P-51 slows down to match the Dora's turn rate. :smilewink: He can neutralize the turn advantage but at the cost of speed. There is a reason why fighter pilots say, "Speed is Life".
-
What Yo-Yo says... I read too far back on the curve.
-
Thank you for sharing, btw! :thumbup:
-
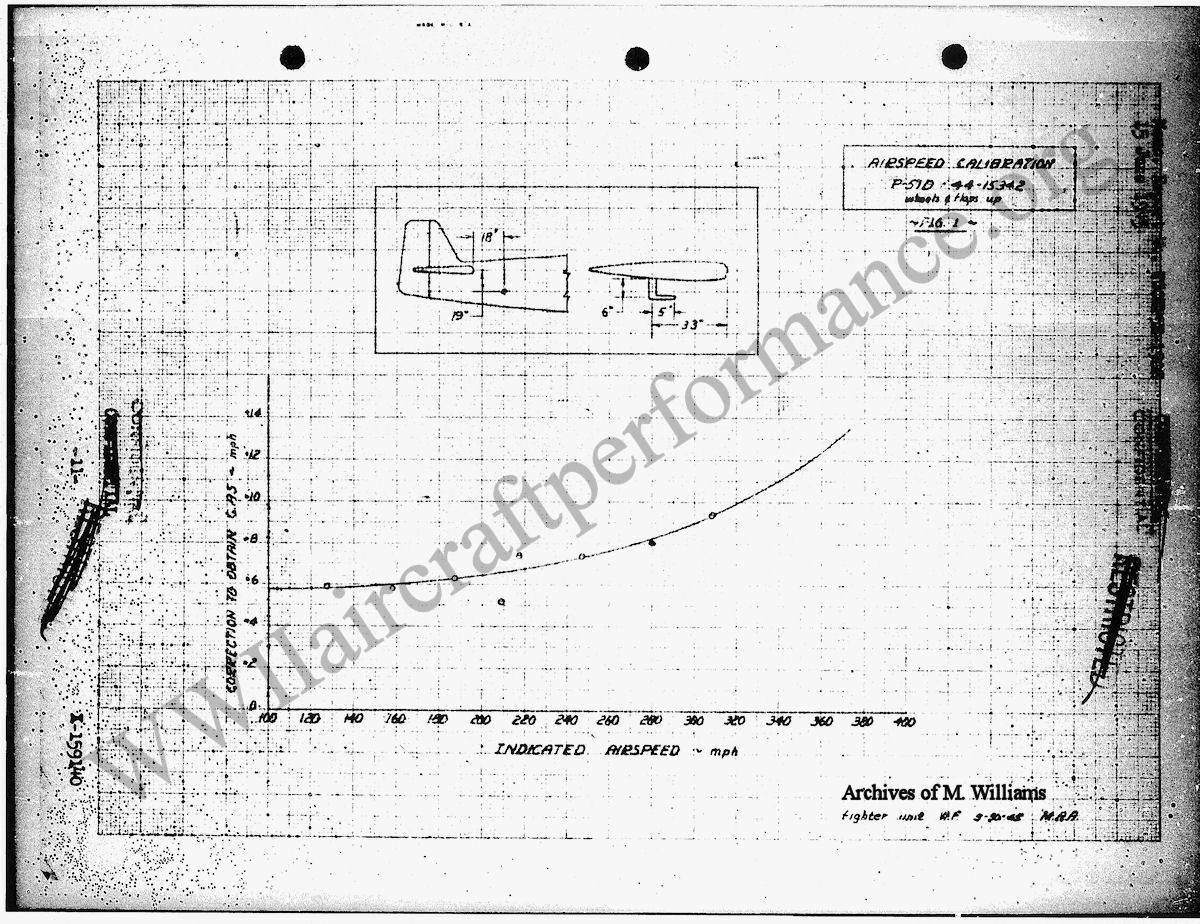
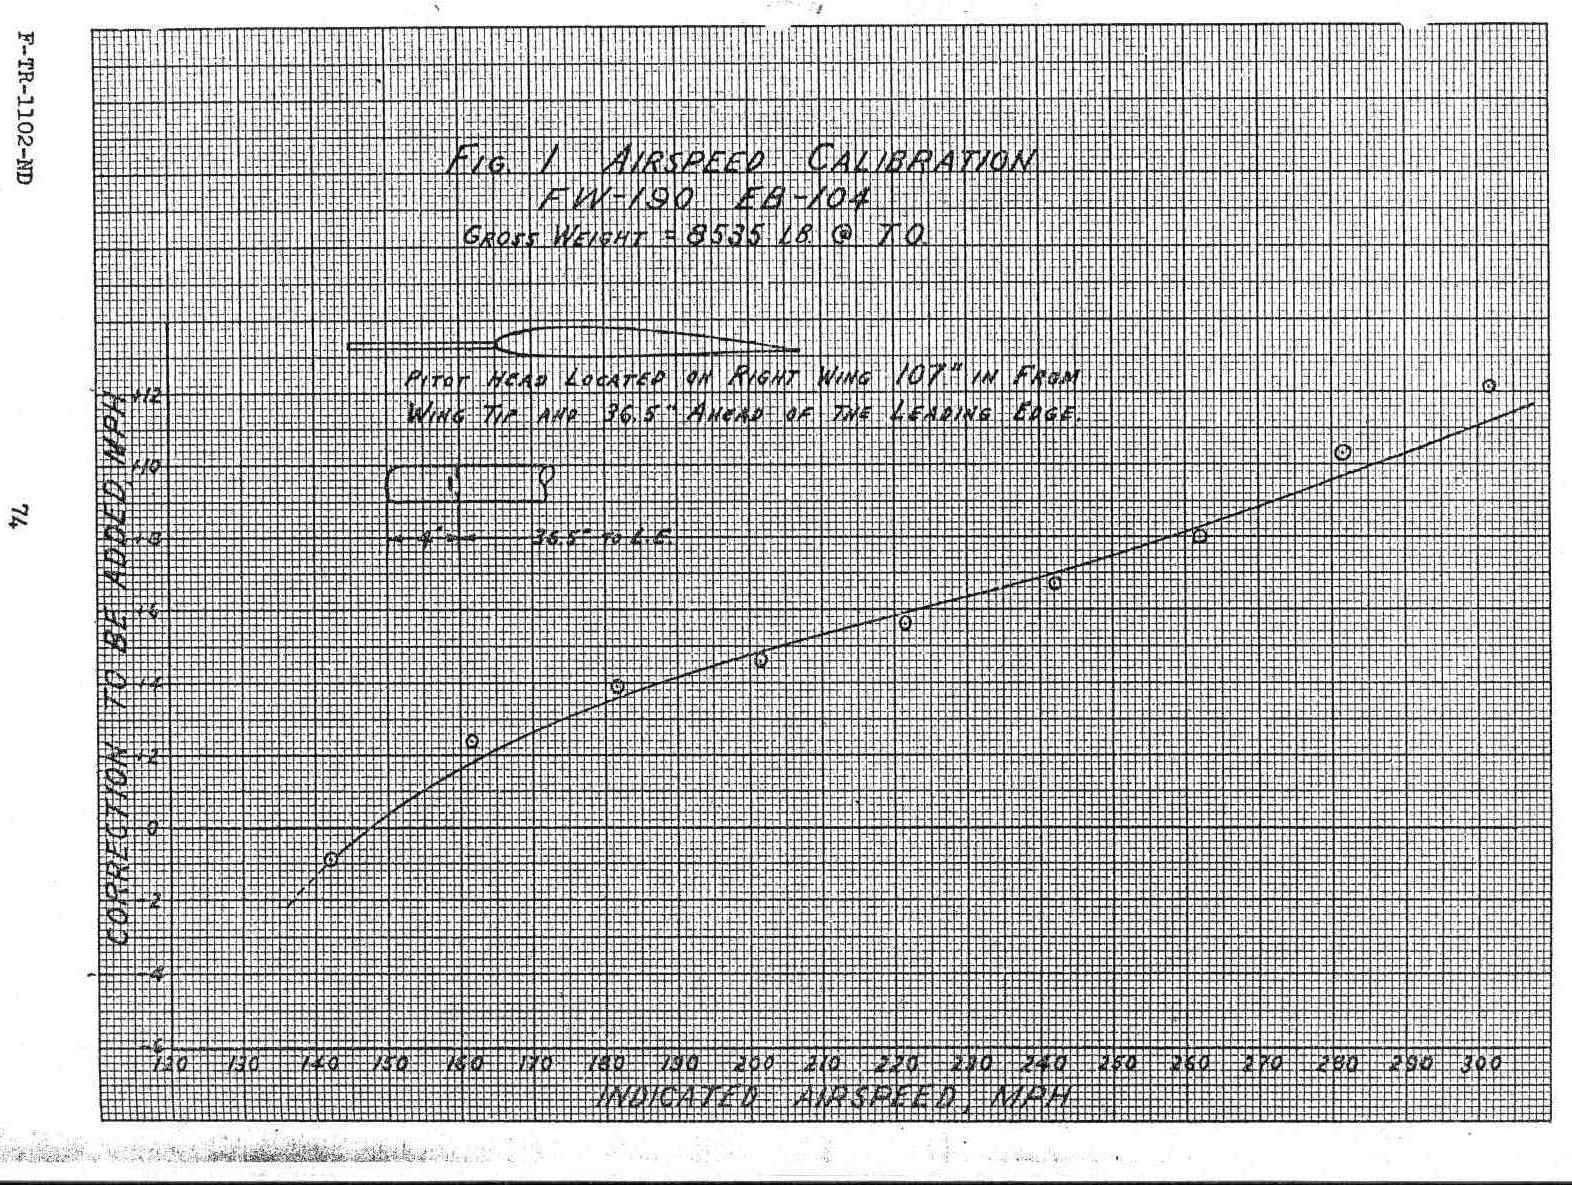
Is that stall speed or just the front side of the power curve? That falls in the vicinity of where the power curve changes in my estimation and most aircraft exhibit some instability on the backside. Reason I ask is it that is not very good agreement with the RAE findings or the vicinity of Vs1 (94.4KEAS) using Focke Wulf's CLmax of 1.58. That is the landing roll, right? 530Meters. Weight the numbers are corrected too, right? 3800Kg = 8377.6lbs That is 15% error over what Chuck Yeager the perfect test pilot with maximum braking application could do. Good flying considering that pilots experience in an FW-190! It is very plausible. Let's see what our CL has to be for a landing speed of 154KpH IAS = Whew...that is off the PEC charts.... Ballparking ~ -10mph PEC correction 154Kph IAS = 95.69mph IAS - 10mph PEC = 85.69mph CAS 85.69 mph CAS * .869 = 74.4KEAS A 8377.6 lbs Aircraft traveling at 74.4KEAS needs: q = 74.4KEAS^2/295 = 18.76p/ft^2 CL = Weight/(q*S) = 8377.6lbs/(18.76p/ft^2*235.75ft^2) = 2.26 That is in the ballpark of a split flap system. IMHO, that makes it really unlikely the 1.58 is the CL max of the aircraft with landing flaps deployed for the performance calcs used on Weiderstandaten von Flugzeugen.
-
All the systems use real life figures and deliver performance that tells us what the airplane will do. Yo-Yo is using a very detailed mathematical model. If it accounts for such things as fuselage lift then he is getting the same performance result without the higher CL. He is multiplying a smaller Coefficient of Lift by a larger reference area. Think of it like this: 2*4 = 8 1*8= 8 Different numbers for the same answer. That is why our performance agrees. The lines on a chart can be misleading too. It looks like a larger difference in Rate of Turn but it actually ~2 degrees a second. What both show is if either pilot tries to match the other...he will lose. The FW-190 cannot fly as slow as the P-51 and its ROT deteriorates if the pilot tries to match the P-51. Lag pursuit in the turn and keep your speed up. You will out-turn Mustangs in the Dora in DCS. If you look behind the P-51 and try to put your aircraft at that point and resist the urge to haul back on the sitck..it works as it should. If you look AT the P51 and try to match its geometry and speed...you going to find your Focke Wulf full of .50 caliber holes. The airplanes are equal dogfighters in both mathematical analysis and the game. He can test it offline but if he is not using the same system or similar to that Focke Wulf used...the performance will not be correct.
-
I will make a new Mustang Track. I did not post the first one because it is harder to see what I am doing on the rudder pedals in the P-51 cockpit. I will do the same routine: Coordinated bank and turn entry left and right, uncoordinated bank entry left and right, aileron rolls and a series of coordinated banks. Coordinated banks are great for developing the muscle memory in your feet. The difference in performance is noticeable and will effect a dogfight.
-
Crap....I will post a Mustang track. Thank you for telling me this!
-
In subsonic in-compressible flow theory as I was taught in college...the airfoil 2D data is used and converted to a 3D airfoil using the induced angle of attack. I also use it because it was the predominate theory at the time in the 1940's with a few variations. In the BGS system: 18.25 = correction factor for knots Cl = coefficient of lift AR = Aspect Ratio Induced Angle of Attack = 18.25(Cl/AR) 3D wing angle of attack = 2D Angle of Attack + Induced Angle of Attack So...in subsonic in-compressible flow theory you USE the 2D data. It is a key element to the determining the performance. For example drag computations, the reference area is designed to just use wing area...not wetted area. Use wetted area and it will deliver nonsense. This is far down in the weeds. If you do this with the system I am using...you will over think it and get the wrong performance. It is set up to use the 2D data and adjusted for conditions from that point. See, that is why I was not screaming for you to change things.
-
You guys cannot watch FW-190 tracks without owning the module? Really? Sure, I will make some in the P-51 for you and post it.
-
I slip to land in DCS too!
-
Common problem. I started a thread a while back trying to teach folks rudder coordination. It might help. http://forums.eagle.ru/showthread.php?t=140143
-
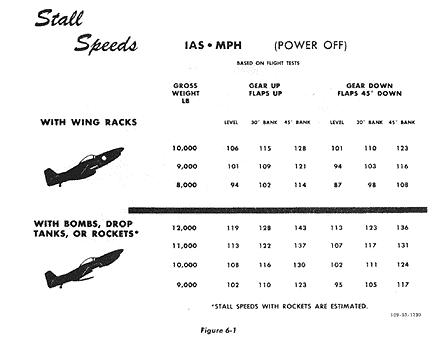
That is really Ok, Hummingbird. Just as there are different ways to skin a cat, there is different theory in aerodynamics. Mixing them can bring trouble. Even switching between the BGS and SI can deliver slightly different results. What is important is not the specifics but the performance trend. There is margin of error in everything. The math shows us what is possible and simply a description of the physical world. What matters in the result in the physical world. Outside of a small Rate of Turn difference, the analysis are almost the same. You know, I have seen several folks post their math and theory pushing it off as some kind of holy grail of absolute truth.....that is not really true or correct. Yo-Yo models reflect reality "in the realm of significant digits" as one of my college professors was so found of saying. That is all you can ask of him. As for the P-51... I used the stall speed chart presented in the POH and interpolated for the max TO weight of 9611lbs for a stall speed of 102.8 mph IAS WITH wing racks. I then corrected that IAS to CAS at sea level using a P-51 PEC curve. 102.8mph + 5.8mph = 108.6 mph CAS; CAS = EAS at sea level = 108.6 mph EAS*.869 = 94.3KEAS An 9611lbs Aircraft traveling at 94.3KEAS needs: q = 94.3KEAS^2/295 = 30.14p/ft^2 CL = Weight/(q*S) = 9611lbs/(30.14p/ft^2*235.75ft^2) = 1.35 Limitations on P-51D and K.pdf
-
Despite being functionally fluent in Spanish....I am glad we are not conversing on a BBS in it. I could not tell English is not your first language!! :book:
-
If you work the Vs2 back to EAS from 105 mph IAS... 105mph IAS - 7 PEC = 98mph CAS - 1CeC = 97mph EAS = 84 KEAS I chalked up his fast approach speed to performing an in-flight stall at altitude on a winter's day. He is doing the same thing I do when when I fly a new airplane. Take it up to up to altitude and stall it in landing configuration to get your approach speed. 105 IAS * 1.3 = 136 mph IAS which is why he used the 130mph IAS ballpark for Vref. His Indicated Airspeed will read fast in the winter at altitude. It takes a 3% error to put us right back in the CL range of a split flap system.
-
Punctiation kills... :P Let's Eat Grandpa!! Let's Eat, Grandpa!!
-
94.4KEAS * 1.15 = 108.56 mph EAS 108.56 mph EAS - (+1) = 109.56mph CAS 109.56mph CAS + 7 mph PEC = 116.56mph IAS = 117 mph IAS That is not even an 1% error. Now if we look just above the CLmax on Weiderstandaten Von Flugzuegen we can see Focke Wulf lists the Coefficients of Lift for: CaR = cruise flight CaA = Approach CaSt = Climb CaA (Approach) Clmax exactly fits this curve of approach speeds. An 8800 lbs Aircraft in Landing configuration at a Vref of 170kph needs: 170kph = 106mph IAS +3mph PEC = 109 mph CAS = 109mph EAS * 1.15 = 94.7KEAS q = 94.7KEAS^2/295 = 30.4p/ft^2 CL = Weight/(q*S) = 9800lbs/(30.4p/ft^2*197ft^2) = 1.47 Well that agrees with Focke Wulf's approach Coefficient of lift. If our CL max in landing condition is 1.58 then we only need to reduce velocity to 91.4KEAS. That is 3.3 knots between approach speed and the stall. A 7 knot gust and you are stalling on approach. That seems like some very tight landing margins and not very likely. http://i61.tinypic.com/15ekdvo.png Of course you know changing Vref is typical of aircraft that have a large weight variance. In the Airlines, we "get the numbers" every take off and landing. I thought it was interesting that the FW-190 pilots also "got the numbers"!
-
BTW, Yo-Yo this thread is not at all a call for you to change anything. Our methods might be different but the general result is the same and gives good agreement. http://forums.eagle.ru/showpost.php?p=2369933&postcount=105 http://forums.eagle.ru/showpost.php?p=2368020&postcount=83
-
Oh yeah, I used an FW-190A4 ladeplan minus the ammo and then determined if he climbed what fuel he would burn and if he had the time to do the test. It was tight, but it worked out.