
Tim_Fragmagnet
-
Posts
124 -
Joined
-
Last visited
-
Days Won
1
Content Type
Profiles
Forums
Events
Everything posted by Tim_Fragmagnet
-
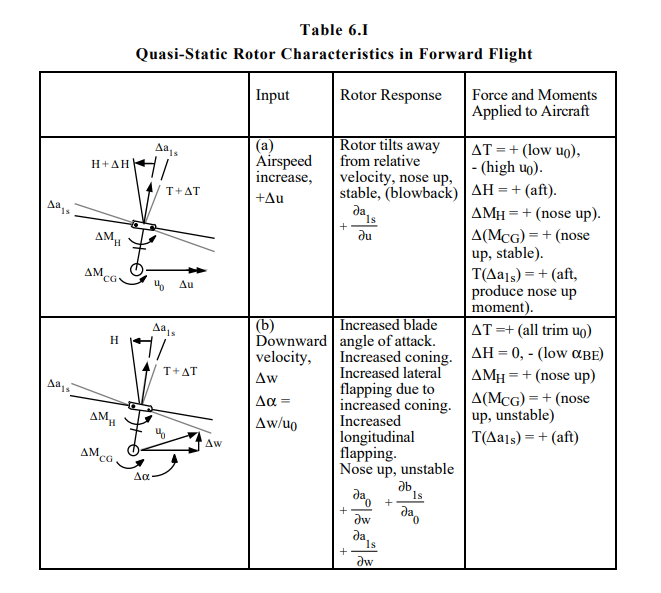
Synchronized elevators implemented incorrectly.
Tim_Fragmagnet replied to Tim_Fragmagnet's topic in Bugs and Problems
I'm just going to leave this here
-
reported Huey's new performance profile discussion
Tim_Fragmagnet replied to Tim_Fragmagnet's topic in Bugs and Problems
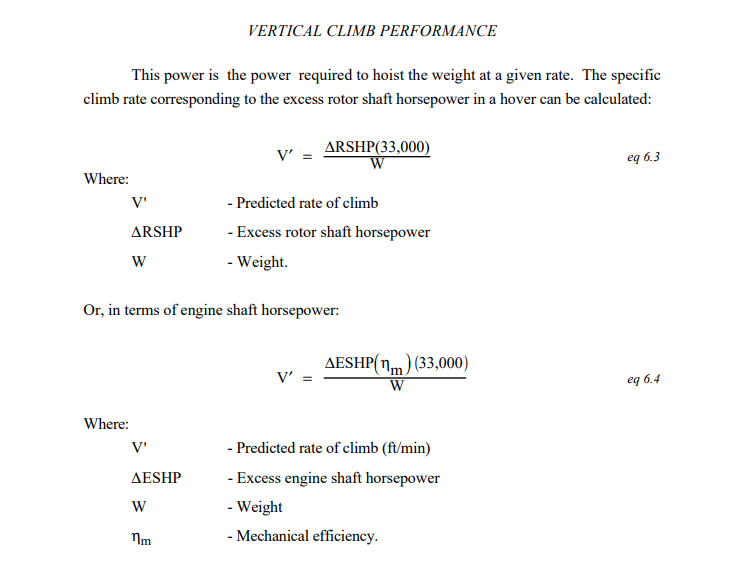
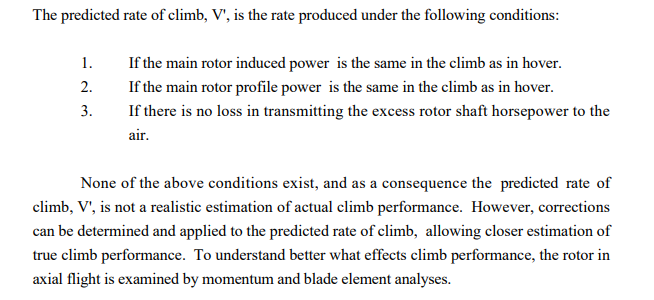
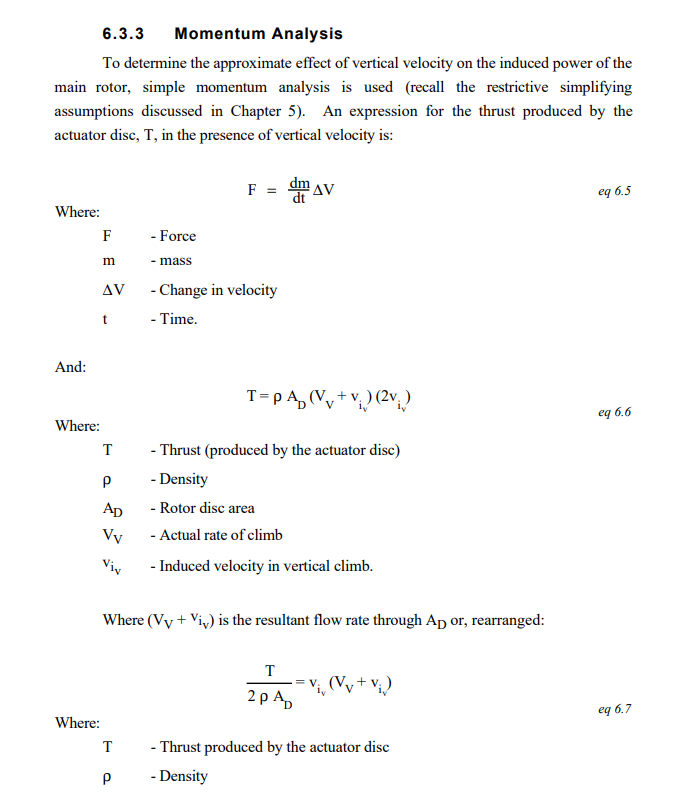
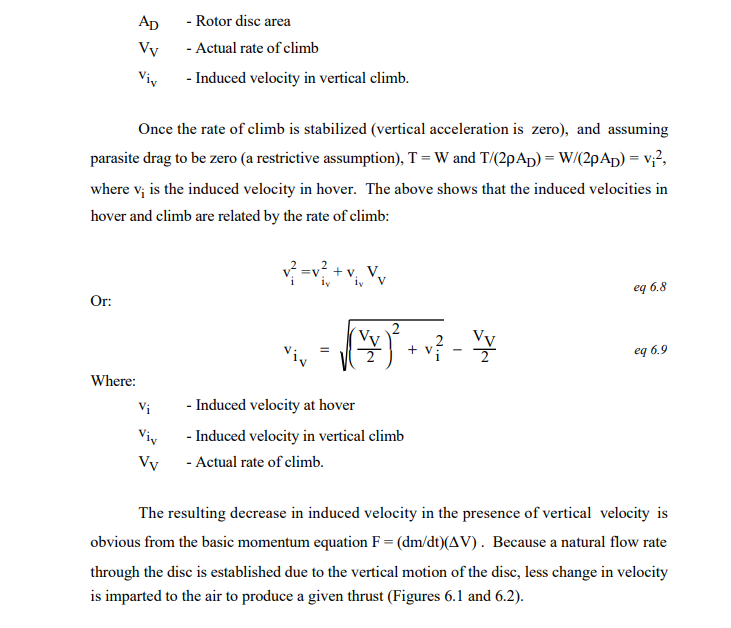
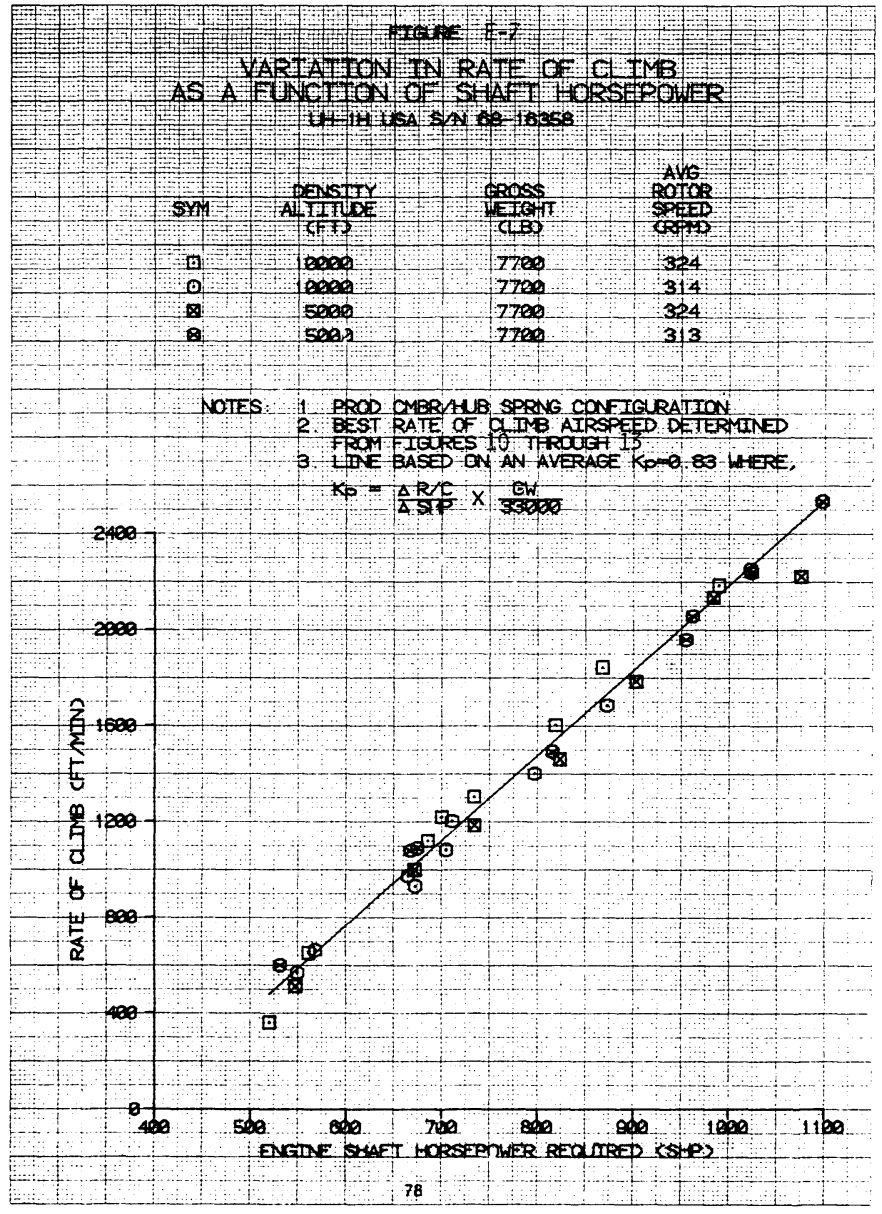
He's asking for climb rate with no forward velocity. Forward velocity reduces required engine power, the highest rate of climb velocity is when the engine uses the least amount of power for level flight. For the huey that's between 55-65 knots. @SMH This is the last time I reply to this argument. However vertical rate of climb has no data available due to how it is made irrelevant by forward velocity. What we do have, however, is thrust data. We can actually acquire vertical acceleration. The OGE hover chart stops recording at 45 Ct, which equates to 12,834.0783692lbs of thrust. Force = mass x acceleration ie acceleration = force/mass so we can get acceleration in Gs from thrust/mass so 12834.0783692/7500=1.7112104492266666666666666666667G subtract 1 G for the force of gravity 1 G = 1930.4429751599998FPM/S thus 0.7112104492266667G = 1372.95FPM/S meaning with that much thrust, the huey at 7500lbs should be able to accelerate vertically, to a rate of climb of 1372.95FPM within 1 second. However this does not provide us possible rate of climb, as the act of air rushing through the rotor vertically, changes things, and momentum exists as well, as does parasite drag. it's not a simple question. however, we can lazily estimate one working backward on the hover chart, we can see that at 9500lbs, (a Ct of 33.30975452) we have a Cp of about 22.9, ( 966.9629541shp) Thus hovering takes 966.9629541shp from the engine. So if we proceed up to a Cp of about 35.3 ( 1490.558615shp (yes that's above its rated 1400shp, it's complicated, one engine pushed 1900shp in testing, the power it is rated for is not the maximum power it can push as that changes with atmospherics etcetcetcetc)) 1490.558615-966.9629541=523.5956609 THUS, as per predicted vertical velocity = 523.5956609 x 33000 / 9500 1,818.8fpm at 9500lbs How about we do this for 7500lbs (a Ct of 26.29) thus a Cp of what looks to be about 17.7, a shp of 747.3905802. 1490.558615-747.3905802=743.1680348 thus 743.1680348 x 33000 / 7500=3,269.9fpm but we know that's wrong, because the increase in power creates an increase in torque, creates in increase in left pedal requirement, which creates an increase in the amount of power taken by the tail rotor, thus a decrease in the amount of power available to the main rotor. That is the Nm in the formula, mechanical efficiency which for the above formulas was assumed to be perfect, which it's not. Which is another thing to calculate, and EVEN IF WE HAD IT. OK SO LETS DO THE MOMENTUM ANALYSiS null OH BUT WE ALSO HAVE TO ANALYZE THE BLADES ENOUGH OF THIS That's enough. I'm not going any farther right now. There's a reason my next thread is taking so long, because it's about actual full on flight dynamics and each individual error's compounding effects on the whole flight model. Do I believe the rate of climb with no forward velocity is correct NO, I don't. Of course I don't. but it doesn't matter right now, because so many other things are wrong that trying to fix the rate of climb before then is literally just a waste of time and effort. The aircraft doesn't even perform properly in a hover. If it doesn't perform properly in a hover, of course it doesn't perform properly in a climb at ANY speed. Fixing rate of climb, first requires fixing hover. THEN when it starts climbing like a rocket because of the correct thrust values provided by the rotor, you fix the OTHER PROBLEMS that cause this. AS PER YOUR OWN WORDS How about you take your own advice. Realize that these things all compound into each other. Fixing ONE, requires FIXING MANY OTHER THINGS. Just because fixing one thing breaks something else, does not mean that fixing that one thing is the reason that second thing is broken. I'm not replying to this poorly thought out argument anymore. I have research to do. Mods, if you have to, lock this thread. Its point has long since been made. I'm just going to make another one the next time a rework happens anyway.
- 96 replies
-
- 7
-

-
- investigating
- performance
- (and 1 more)
-
reported Huey's new performance profile discussion
Tim_Fragmagnet replied to Tim_Fragmagnet's topic in Bugs and Problems
Actually, I have a bunch of that kindof data too This aircraft and its constituent parts were tested and documented in extreme detail. But yes the argument has gone on long enough and won't change much. The need for another rework has been acknowledged and we'll get it eventually.
- 96 replies
-
- 3
-
-
- investigating
- performance
- (and 1 more)
-
reported Huey's new performance profile discussion
Tim_Fragmagnet replied to Tim_Fragmagnet's topic in Bugs and Problems
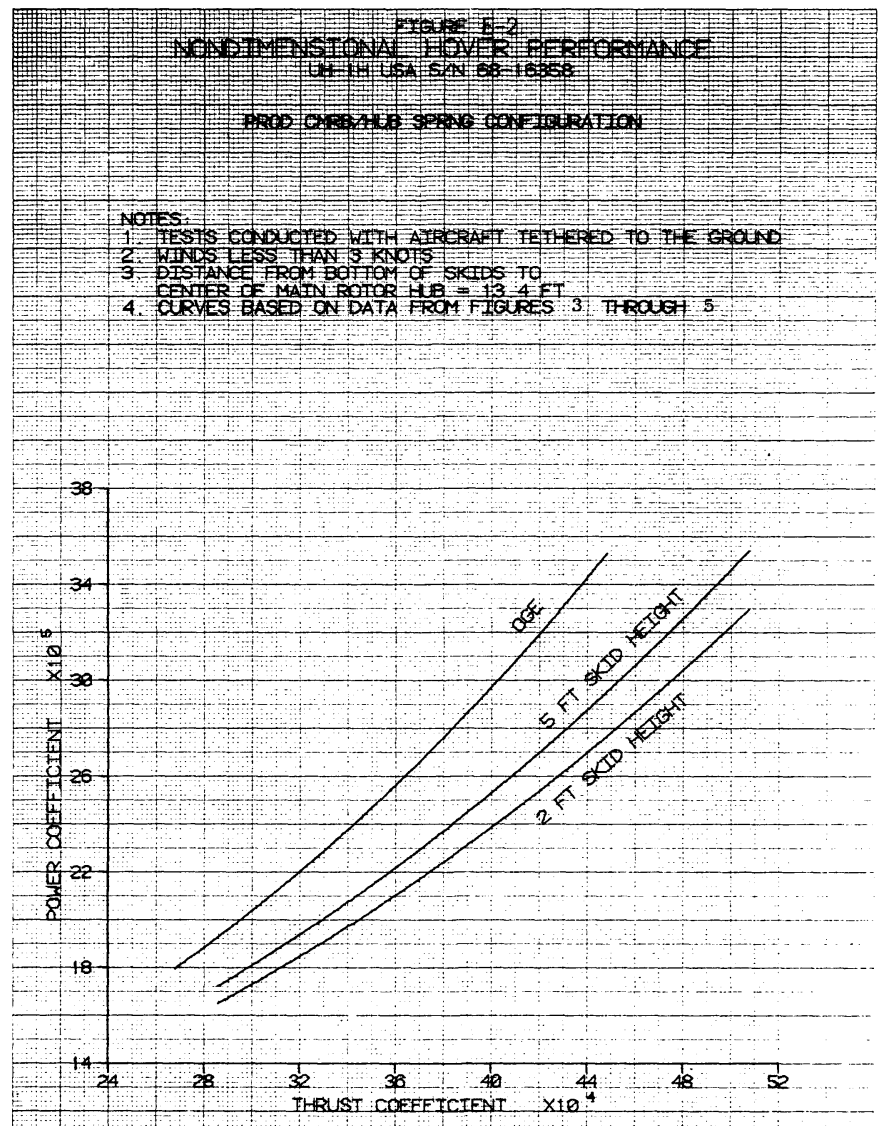
Well at standard day the coefficient of power would be 29.5 thus the end result is about 1.5inches from full left which is still close enough to be considered standard deviation. However. I have not once denied that the amount of engine power required in a hover is wrong. It is wrong. That's exactly what this chart from the opening post details This chart shows exactly how much lift is produced for any amount of given power. As we can see, in no situation is it correct. In every case we are producing far too little lift for any given input power, especially while out of ground effect. Out of ground effect is actually the most important one there, because that is the rotor producing lift with nothing else interacting with it, meaning that is the baseline performance of the rotor, if that is wrong, everything else is wrong because of it. If you fix the rotor, the engine power required comes down, the left pedal requirement eases up yes, the engine needs more work I have said that on multiple occasions but it's not just the engine. it's the rotor it's the flight dynamics it's tweaking the ground effect. Yes, the amount of left pedal required for any amount of input torque is close enough but the amount of torque required for any amount of lift is not. thus the amount of left pedal required for any amount of lift is not correct. because the lift is not correct.
- 96 replies
-
- 4
-
-
- investigating
- performance
- (and 1 more)
-
reported Huey's new performance profile discussion
Tim_Fragmagnet replied to Tim_Fragmagnet's topic in Bugs and Problems
ok so we're going to do it this way then. @SMH You want to keep complaining about left pedal requirement. So allow me to prove you wrong on that front. In your previous image you conveniently didn't provide information on the air temperature, so I'll assume the default of 20C your torque is at about 54psi. the torque gauge on the huey reads 54psi at about 1247.5shp. 1247.5shp results in a coefficient of power at 20C of about 30. at a coefficient of power of 30, we should see a coefficient of thrust of about 39.3 so what does this mean. Well, if we look at the OGE hover chart. We can see that at this coefficient of thrust presented from our coefficient of power, we need a pedal input of 1.2 inches from full left. 1.2 inches from full left in a flight profile that produces 54psi on the torque gauge. ok but we can't really do anything with that information if we don't know how much travel the pedals have but we do know how much travel the pedals have 7.7 inches. so lets just do this then Looks close enough to me. You can stop complaining about left pedal now.
- 96 replies
-
- 5
-
-
- investigating
- performance
- (and 1 more)
-
reported Huey's new performance profile discussion
Tim_Fragmagnet replied to Tim_Fragmagnet's topic in Bugs and Problems
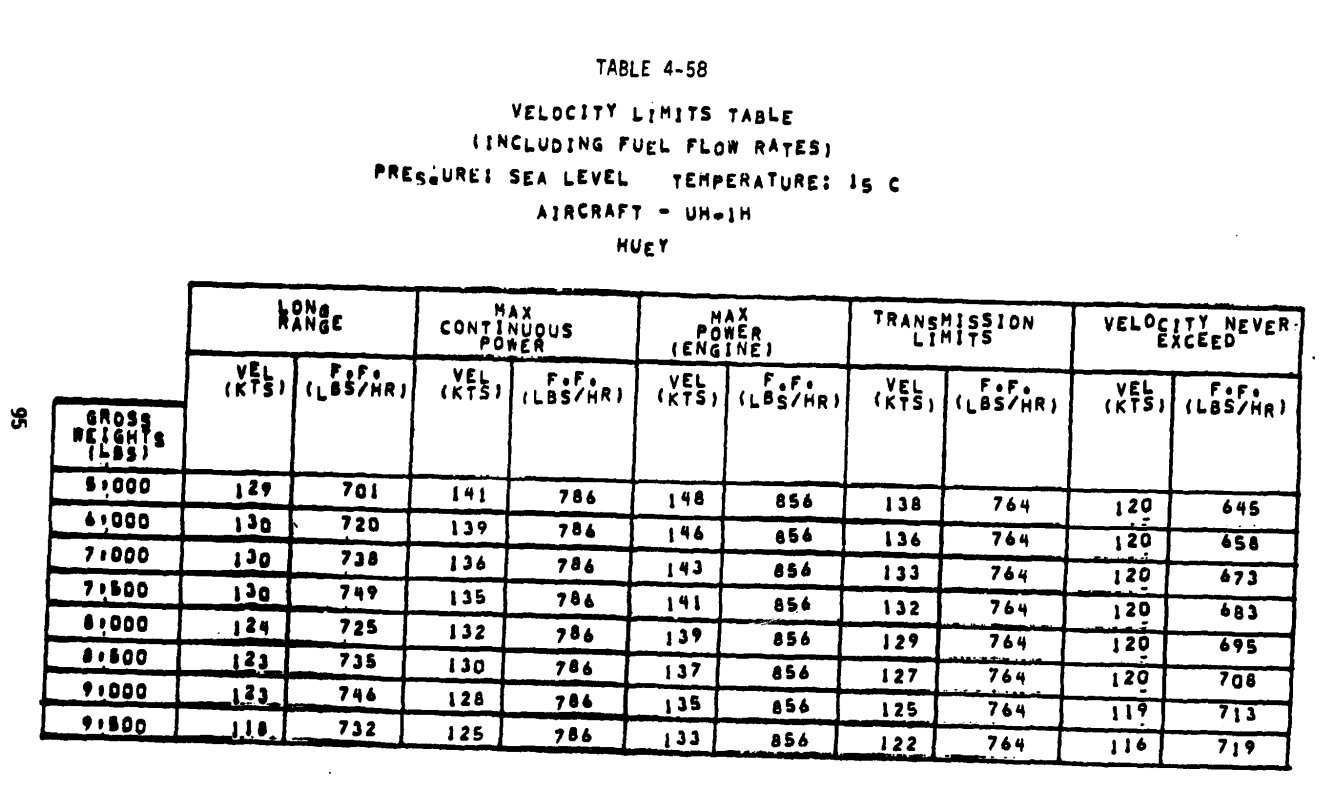
@SMH I'm going to make it as simple as possible for you. Since you're having an issue comprehending it. The rotor does not generate enough lift, thus meaning, for any specific volume of lift generated by the rotor, you need to apply more power than is realistic. So, with the unrealistically high power requirement, that also brings about an unrealistically high left pedal requirement. This isn't saying that the engine currently has too much power in dcs, quite the opposite, at the high end it does not have enough. The reason real pilots don't use that much left pedal, is because they never go into those power ranges, because the machine does not need to. The official Vne of the UH-1H is about 120knots. This means that pilots are encouraged to stay below this speed, not that the machine can't physically pass it. At sea level, at 15C At 120knots, at 6500lbs, the torque gauge should be at about 31.8psi At 120knots, 9500lbs, the torque gauge should be at about 39psi 39psi to reach the machine's Vne 39psi on the huey's torque gauge is when the engine is pushing about 912shp to the drivetrain Read that again. 912shaft horsepower, to go 120knots while at a weight of 9500lbs. The transmission is rated for 1158shp, the engine itself at sea level is capable of pushing out 1390shp. And yes, the engine can in fact push all 1390shp through the transmission into the rotor and overtorque the drivetrain. Yes, this means that the UH-1H from the 90s, IE the one we have, as engineered, has a SIGNIFICANT portion of excess engine power available to it that simply goes unused most of the time. This is no "super huey", in fact it's quite weak as it stands due to the low volume of lift generated by the rotor. ______________ Now, I, and I'm sure many others, would appreciate it if you would do more experiments and provide test data, but only post about it when you are CONFIDENT in your results. No more half answers, no more guesses, no more improperly tested theories. I previously fell into that trap. When I realized what I was doing, I stopped entirely. Sat down, and asked myself. "Do I actually know what I'm talking about?" At the time, the answer was no. So I took a step back and wondered, "how many huey documents are there?" As it turns out, there are a LOT, this machine was brutally tested and documented in multiple stages of development at multiple times. I quite literally took an entire year to sit down and go through as many huey documents as I could find. I will tell you this right now. I previously did not know what I was talking about, but I now realize A lot of people on here don't know what they're talking about either. Because I now know at least a little of the truth. So please, step back, and take your time to test your theories properly. Do some thorough research. Give it a few months. Gather as much data as you can. And then come back and we'll chat about it.- 96 replies
-
- 5
-
-
- investigating
- performance
- (and 1 more)
-
reported Huey's new performance profile discussion
Tim_Fragmagnet replied to Tim_Fragmagnet's topic in Bugs and Problems
Define fully loaded. Do you believe 9500lbs is ACTUALLY fully loaded? Because the real thing can hover at over 13,000lbs at sea level 2ft off the ground. The 9500lbs MTOW is not the weight at which it can no longer hover and take off at, it is the weight at which the engineers are confident with what the airframe is going to do during maneuvers. Also, what are the conditions your claims are being made in? At what temperature? At what air pressure? At what altitude? External stores or just internal cargo? Is it raining? Is there icing on the rotor? How high are you pushing the torque? I'm not sure what point you're trying to make, because as it stands, the huey is significantly UNDER performing in a hover. As per the data recorded by real pilots and flight engineers, and I trust their claims far more than I trust yours. The data I have been working with is from our exact model of huey, The WSPS from 1979 The new particle separator from 1988 The new rotor blades from 1989 Yes, our huey is from the 90s. No, the new performance model is not perfect, it has some big issues. However, the old performance model was worse overall. Just because you LIKED the old performance model and got used to it over time, does not mean it was realistic. Enough of this. I have documents to look through.
- 96 replies
-
- 6
-
-
- investigating
- performance
- (and 1 more)
-
reported Huey's new performance profile discussion
Tim_Fragmagnet replied to Tim_Fragmagnet's topic in Bugs and Problems
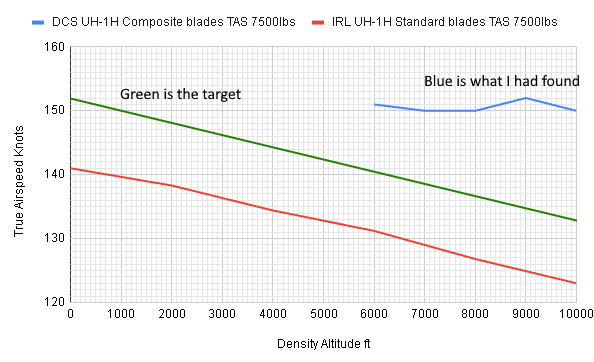
I've been busy researching flight dynamics and constructing a document regarding the DCS huey's flight model and its critical glaring errors that have somehow gone unchanged for an entire decade. However, I am going to take the time to simply say this. If you think the new huey performance model is overpowered, you are wrong. In cruise above around 90knots, the new huey performance model is still UNDER performing. It should actually be going faster at any power setting at these speeds at any weight than it currently does. Once again, the point being made isn't the speed the module can reach, the point being made is the engine power used for any specific speed/weight combination. If you think the problem right now is speed, you fundamentally misunderstand the problem. As it stands, the engine is almost correct, it just lacks power at high throttle settings the actual main performance problem is the lift provided by the rotor being entirely wrong.- 96 replies
-
- 7
-

-
- investigating
- performance
- (and 1 more)
-
The reason why the copilot can't hold a heading is actually fairly simple. it's because the forces acting upon the helicopter in flight are not properly balanced while the autopilot is acting like they are. I'm working on a flight model/dynamics document that will go into detail as to what's going on, give me time . But in short, translating tendency is simply not modeled in the aircraft due to the lack of lateral thrust by the tail rotor, its presence in high speed flight is faked by the excessive torque requirement at cruise speeds. Combined with the improper volume of aerodynamic side force acting upon the helicopter and you end up with an autopilot that tries to fly wings level but ends up veering off course because the torque isn't balanced properly by the side forces on.. enough, you get the idea. The autopilot wasn't designed to veer off course deliberately.
-
reported Huey's new performance profile discussion
Tim_Fragmagnet replied to Tim_Fragmagnet's topic in Bugs and Problems
I have cleaned up the torque/speed graph and adjusted it to represent the huey in a clean configuration. (If you don't want to model the huey as having its clean configuration performance, you shouldn't let us take off the IR suppressor.) I have also extended the transmission limit data.
- 96 replies
-
- 11
-
-
-
- investigating
- performance
- (and 1 more)
-
Flight controls behaviour after the latest update
Tim_Fragmagnet replied to RazorbackNL's topic in Bugs and Problems
The huey has no weight on skids feature, no. But what it does have is the RPM governor, which is part of the throttle control for the engine. This system is designed to automatically control the engine throttle to keep the RPM of the engine, and thus the rotor, high enough, without going too high. As the torque is increased (the RPM decreases), the governor bumps up the throttle to attempt to maintain engine RPM. Additionally, the droop compensation system exists as well, it is directly connected to the collective. Effectively it is a lever that raises as you raise the collective to automatically raise the throttle as well, effectively mechanically automating part of the (already mechanically automated) governor which would otherwise lag behind. Now here's the kicker. What doesn't really change while on the ground? Torque, you're either idling the rotor, or raising the collective to increase blade pitch, at which point you gain lift and thus flight with weight no longer on the skids. A bug in the governor system caused that funky behavior, to happen while on the ground but not in flight. Once you're in flight, the governor is already compensating with the throttle. The engine parameters had been changed, but the governor had not been corrected for this change. Effectively while idling on the ground, the correction applied by the governor is zero. The moment you start applying torque, the governor kicks in. The total range of correction available to be applied by the governor was set to an incorrect value thus causing the sudden massive surge of power, allowing you to fly in impossible configurations. In short. It's DCS, it's a simulator. Nothing works exactly like it does IRL, there's funny 20-30 year old coding going on to make sure of that. That funny throttle behavior was likely just an oversight caused by the huey's engine/performance not being majorly modified effectively since launch a decade ago. Overall, the current major issue with the huey is the volume of thrust generated by the rotor for any given amount of engine power. -
Flight controls behaviour after the latest update
Tim_Fragmagnet replied to RazorbackNL's topic in Bugs and Problems
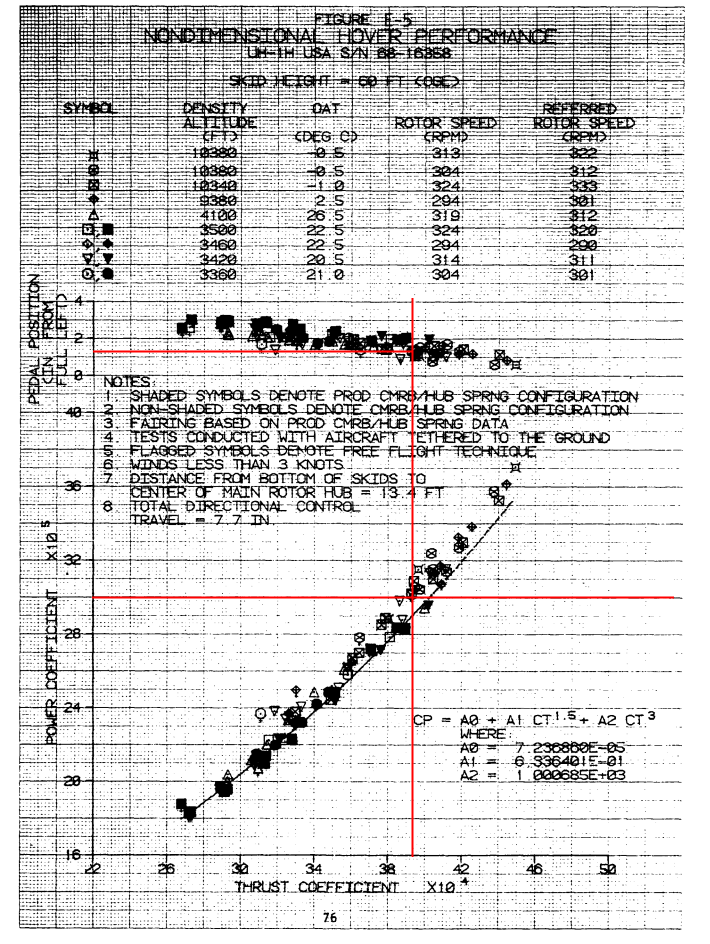
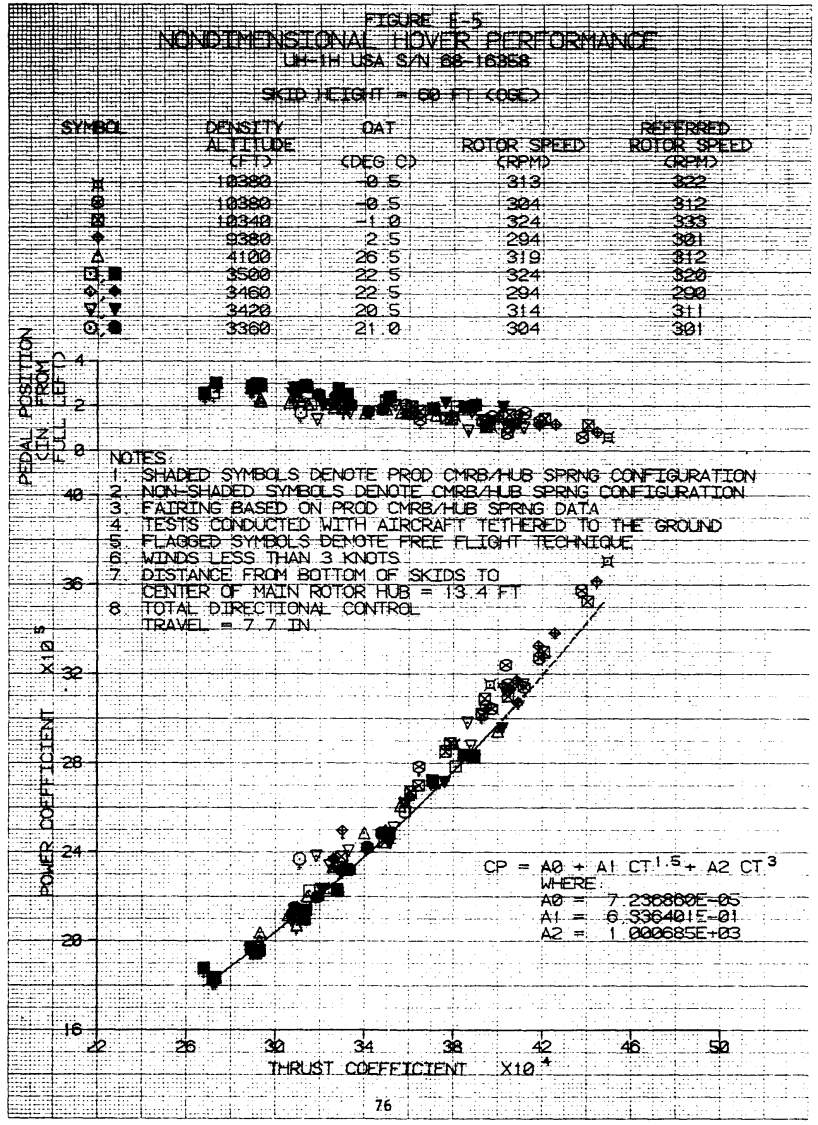
The issue here isn't actually the engine or transmission It's the rotor itself. At low speeds the rotor doesn't produce even remotely enough thrust. As per our profiled hover chart. The problem isn't that we have too much power available, the problem is that it takes too much power to hover, because the rotor doesn't produce enough thrust. If the rotor were producing the correct amount of thrust, the blue dataline would match the OGE data. From there ED would need to tweak ground effect itself to make the red and yellow plots match the 5 and 2ft hover data. And yes, that graph means that the DCS huey requires more engine power to achieve a 2ft hover than the real thing needs to hover out of ground effect within the stated MTOW of 9500lbs.
-
reported Huey's new performance profile discussion
Tim_Fragmagnet replied to Tim_Fragmagnet's topic in Bugs and Problems
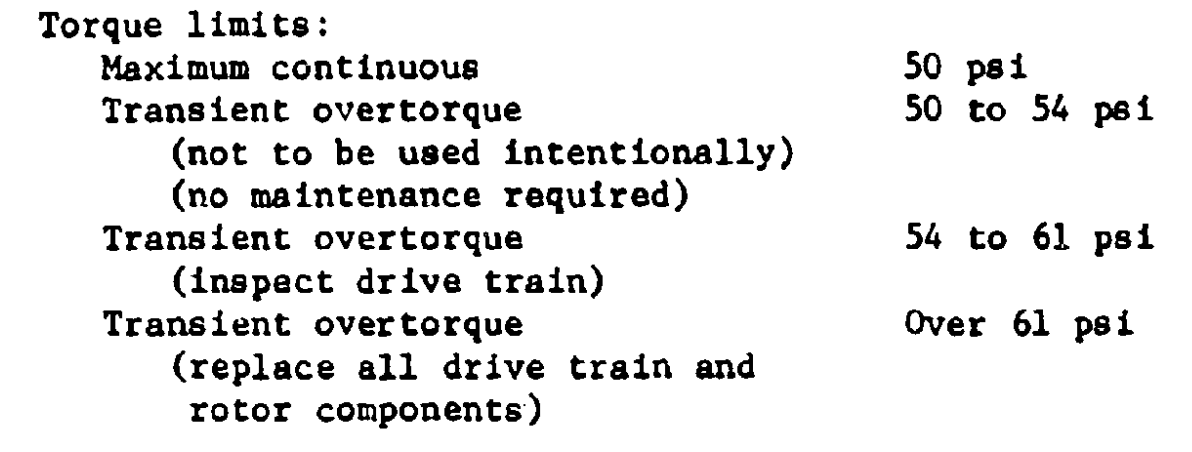
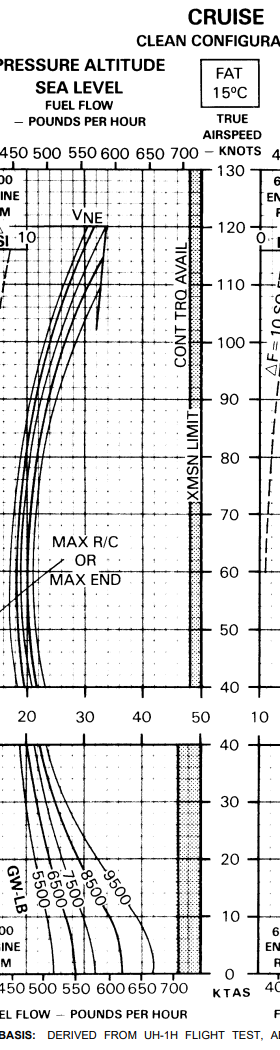
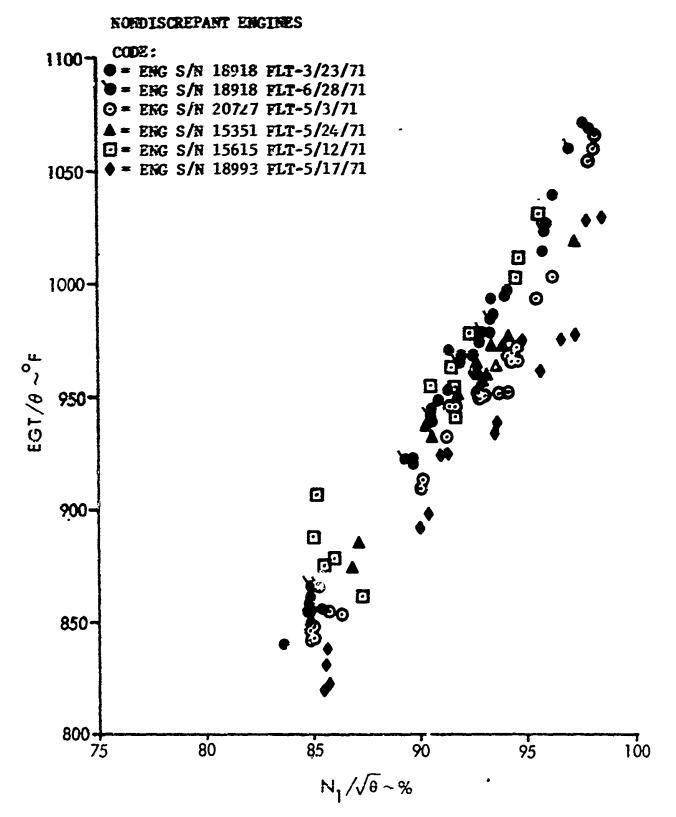
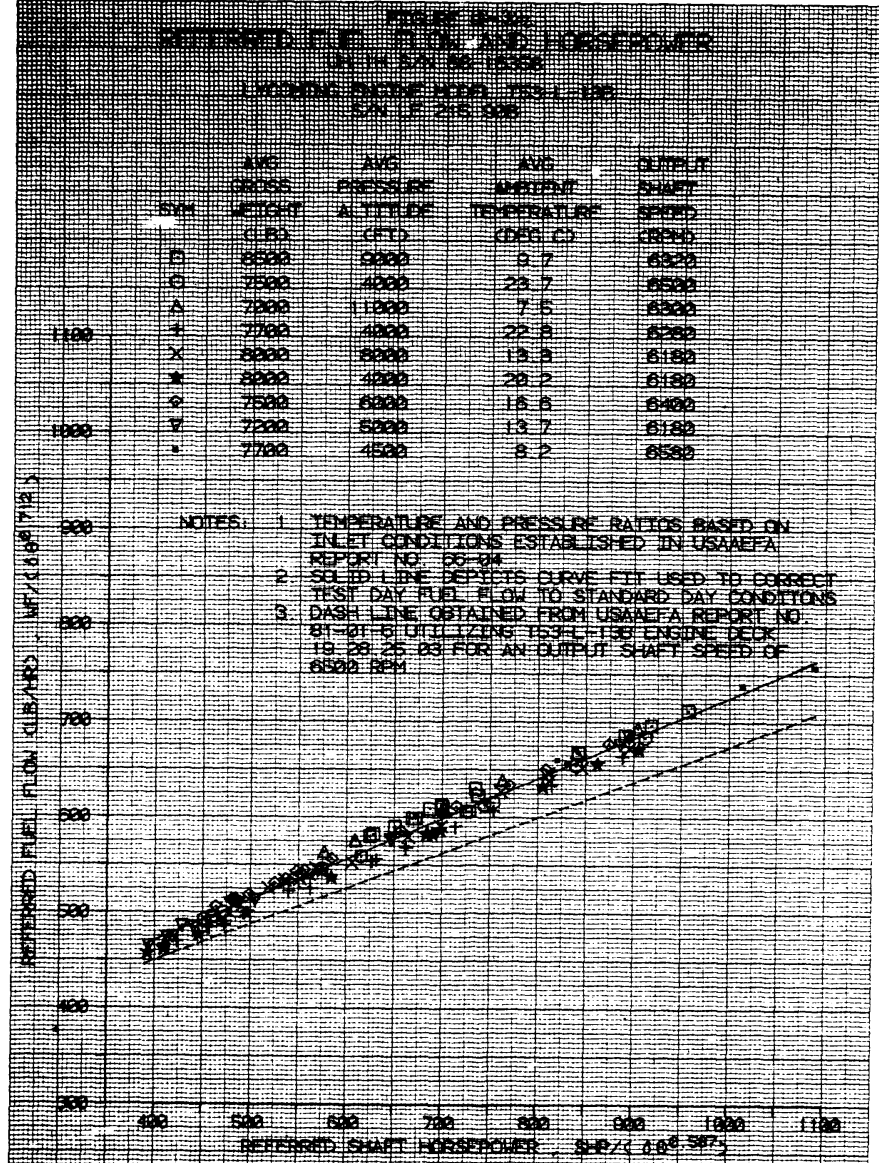
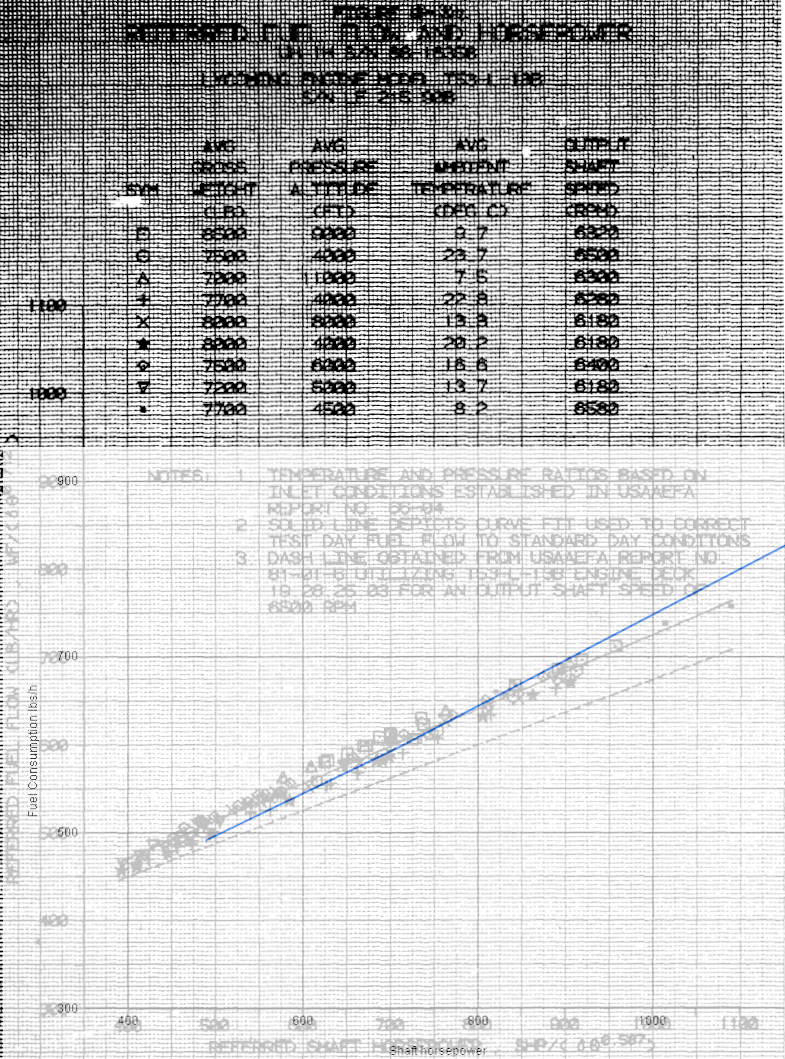
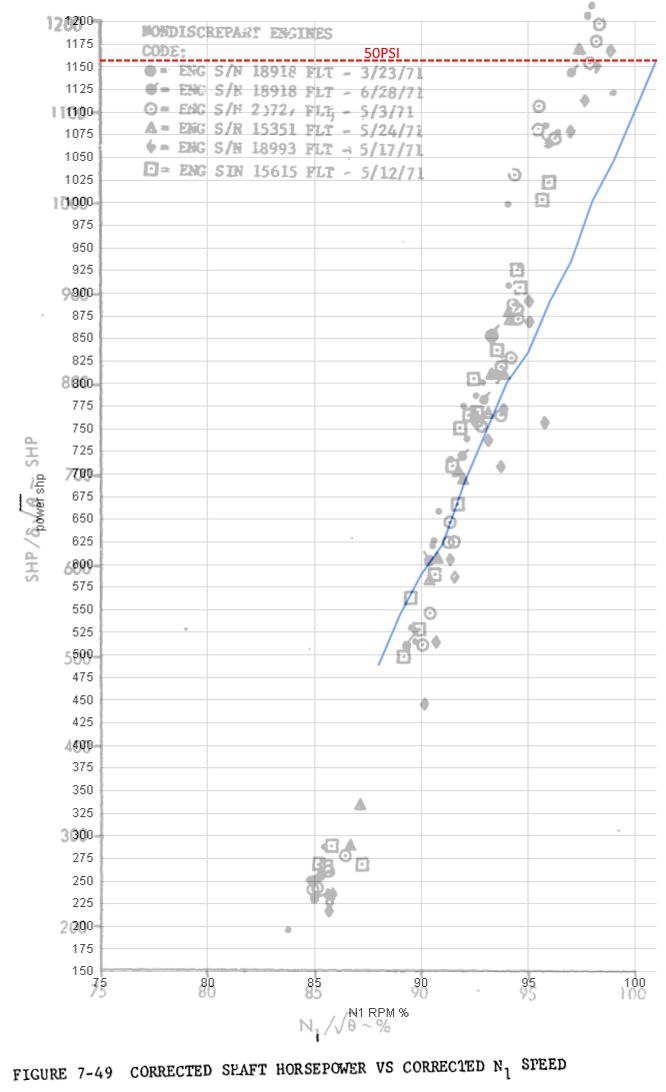
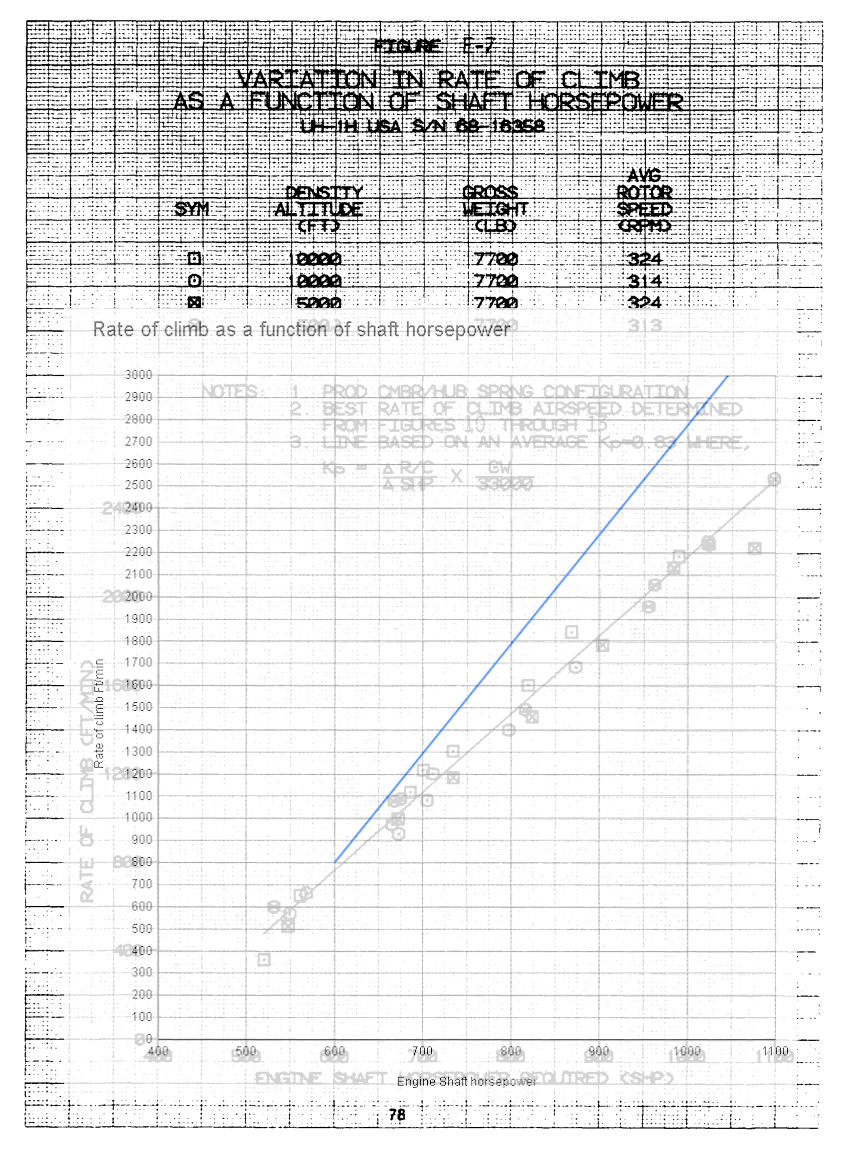
I'm going to open with this, I am not looking for perfection, I am merely looking for "Good enough". Additionally, this is about the PERFORMANCE, model, not the flight model. This is about making the engine use the correct amount of power and fuel for any specific flight profile. So, profiling the huey. Where to begin. Well I feel it prudent to start with the torque calibration factor once again. This isn't something you can profile, but understanding what it is allows you to understand the potential flaws in the current method of profiling. So, what is the torque calibration factor. As simple as possible, this is the value the torque gauge reads while the engine is putting out 1125ft-lbs of torque. So why is it important? The Torque Calibration factor is important because ED has not provided one for our huey, and it is effectively impossible to determine as a client. Therefore, we will assume a calibration factor of 61.4. As shown by the calibration factor chart, this provides a 1:1 representation of indicated to calibrated torque, what you see is what you get. 50psi, is 50psi. It is, however, still important to understand the implications of doing this. If our huey were tuned for a calibration factor of say, 66, our torque gauge at a reading of 50, would actually be corrected to a torque of around 43, a difference of 7psi. Conversely at a calibration factor of 54, 50psi indicated would instead actually be a real torque of well over 50psi. However, as per the graph, this error gets lower and lower as the indicated PSI gets lower and lower. This means that to correct for an anomalous calibration factor, you cannot simply just shift the entire graph up or down. It would need to be adjusted for each datapoint. Additionally, note that the correction is always in one direction, if your calibration factor is above 61.4, your indicated PSI ALWAYS reads high, if your calibration factor is below 61.4, your indicated PSI ALWAYS reads low, it doesn't change throughout the range of torque. However, all data for the real huey is presented in calibrated torque. So if we assume our huey has a calibration factor of 61.4, this would mean that the graphs generated through empirical tests should match up nearly identically with the real thing. So. Where do we begin? First, here is the test mission. Huey Test 15C 29.92inHg.miz Lets start with the static tests. Let's start with the fuel test, the goal here is to profile how much fuel the engine uses for any specific volume of power usage. The method is actually fairly simple. First, use the cargo trigger included in that mission file to add 10,000 weight (it's in kg) to the huey. This will prevent our aircraft from moving during this test. Next, with the aircraft hotstarted on the ground, we raise the collective until we reach the desired volume of power (torque) we wish to test at. Then we time how long it takes for the engine to run out of fuel, you can use the F2 menu's time for this as the huey's clock isn't entirely accurate. Then we repeat for multiple different volumes of power. With our data gathered, we must process it so it is usable on our reference graph. We must provide fuel use in pounds per hour in relation to the amount of specific shaft horsepower used. We have the time it takes to drain all the fuel in minutes We have the indicated torque required to drain the fuel in this time Starting with turning the fuel to lbs/hour, that's actually fairly simple. 60/time in minutes, then multiplied by the total fuel load drained (max fuel is 1391lbs, max fuel will provide the most accurate data) So (60/170)*1391=490.94lbs/hour Now we will turn torque in to shaft horsepower. Take the Torque in PSI and the Rotor RPM, and process those 2 pieces of data through this formula. 3.88*((10^-3*ROTOR RPM)*((17.76*PSI)+33.33))=Total Shaft Horsepower Now that we have processed the data, we can plot it on the graph. Do note, that formula is only for the UH-1H. So, the next static test is the power/throttle profile, which can additionally be used to chart EGT data as well. This involves checking how much power is provided for any specific volume of N1 on the N1% gauge. Since you now already know how to turn torque and rotor RPM into shaft horsepower, this is simple. Using the stationary huey, measure at torque values specifically marked on the torque gauge (20,25,30,35,etc) and then observe the N1% on the gas producer gauge. (this is more accurate than the other way around.) While you are doing this, gather EGT data as well for each point you measure. Convert the torque to shaft horsepower, and then plot the data on this graph. Then using the EGT data you also gathered during this test, plot it on this graph. Do note that this graph is in Fahrenheit so you have to convert C to F. So, those are the tests that can be done without moving the aircraft. Up next are the flight tests, we'll start with hover tests. I will refer to the previous post for a more detailed description of the hover test and will simplify it here. Simply put the aircraft into a hover at several different weights, and at heights of 2ft,5ft, and out of ground effect (over 60ft but ideally less than 100ft), and record the torque required at each point. Process the data with these formulas. (you can obtain the shaft horsepower from the earlier formula to convert torque into shp) Power Coefficient = ((SHAFT HORSEPOWER*550)/((0.02289013*PRESSURE INHG/(TEMPERATURE C +273.15))*1809.56*(((ROTOR RPM*2π)/60)*24)^3))*10^5 Thrust Coefficient = (TOTAL THRUST [gross weight for this test] IN LBS/((0.02289013*PRESSURE INHG/(TEMPERATURE C +273.15))*1809.56*(((ROTOR RPM*2π)/60)*24)^2))*10^4 And then graph the processed data on this graph. With the hover data completed we move onto forward flight. I have thrust coefficient graphs for the huey in forward flight, however they are unusable by us as clients for reasons stated in the previous post. So we will use the torque chart presented to us in the huey's operator's manual. Specifically the sea level one, because if this one isn't correct, that means the baseline performance isn't correct to begin with. We will also no longer be correcting for the 2 square ft of drag added by the IR suppressor, as not only does it not affect the flight model in any way other than weight right now anyway, we should profile the base, unmodified performance of our variant of the huey, in the same configuration it was profiled in for our data. To do so is fairly simple. In the F2 view during gameplay you are provided with a status bar at the bottom of your screen, within this bar is a measurement of your speed. By default it is set in IAS, however if you press CTRL+T it should toggle it to TAS unless you have rebound this. All flight tests are measured in TRUE airspeed. Not indicated. Using the F2 meanue provides the actual TAS of the aircraft before any speed gauge inaccuracies are modeled. Simply fly the aircraft at a bunch of different speeds and weights and record the torque for each condition. Ideally you don't fly to a specific speed, instead you fly to a specific torque, as the torque gauge is harder to read, so using its marked points allows for more accurate data collection. Multiple sets of data for the same condition can be done by restarting the flight and doing it again. This can help remove any outliers in the dataset. Do not forget to use the unlimited fuel setting to prevent the data from being skewed by the reduction in weight from the fuel consumption during flight. Additionally, do not forget to make sure the mission is not overriding the unlimited fuel setting, thus making your aircraft consume fuel regardless, without your knowledge of it doing so. Up next, the rate of climb data. This is obtained by flying at 55-60knots TAS at different power settings (torque) at a specified weight (7700lbs for this test), and then noting your rate of climb. Interestingly, the data shows a minimum reduction in rate of climb at different altitudes, so it shouldn't matter up to 10,000ft If you want to one up me in this area, record multiple sets of the data for different altitudes. Just remember to keep adjusting your flight to maintain your speed and torque. Up next is the max power speed per altitude data. While I could provide the data to derive the graph for this test, it's tedious and annoying, so I recommend just using the one I have already made. (it involves taking many tables of data and interpolating it) The test is simple. At 7500lbs, fly as fast as you physically can in level flight at different altitudes. Ignore all restrictions, egt limits, torque limits, Vne, all of them. Crank the collective and go. If you can't keep the nose down, lower the collective, and flag that datapoint. Here is the graph. So where do we go from here? Well for now, I'm sure you have enough to think about. However I have some things to think about and process for myself The data is probably for another thread. But it does make me smile. Until next time, keep that mind sharp.
- 96 replies
-
- 6
-
-
-
- investigating
- performance
- (and 1 more)
-
My findings lead me to believe that an engine rework was already in progress by the time I had made that thread, I believe most of that data was too late to majorly affect the rework. I will not take credit for ED beginning to rework the huey, as I do not believe it is earned. However I am doing my best to see the rework continued and supplied with as much good data as I can find.
-
reported Huey's new performance profile discussion
Tim_Fragmagnet replied to Tim_Fragmagnet's topic in Bugs and Problems
I have redone the fuel profile for the new update, and have compiled it into the main post. I will write up the post about how to profile everything within a few days 20PSI 1391lbs fuel 170 minutes.trk 30PSI 1391lbs fuel 139.5 minutes.trk 50PSI 1391lbs fuel 100.5 minutes.trk Something feels off about the droop compensation, it feels far too weak now. I'll have to test that more.
- 96 replies
-
- 2
-
-
- investigating
- performance
- (and 1 more)
-
Can we go back to the old flight model for the Huey....
Tim_Fragmagnet replied to StreakerSix's topic in DCS: UH-1H
That's correct. Helicopter controls as a whole are extremely sensitive on pretty much every helicopter, including the huey. here's a timestamped video example. http://www.youtube.com/watch?v=0cUXsCmi9Uc&t=136s -
Can we go back to the old flight model for the Huey....
Tim_Fragmagnet replied to StreakerSix's topic in DCS: UH-1H
I personally use a 300mm extension on a VKB gunfighter. It's still not enough. The cyclic on the UH-1H has a throw of about 12.4inches measured from the center of the grip in an arc. The vkb gunfighter has a gimbal range of +-20degrees, so a total of 40 degrees. so with a throw of 40degrees, a total length from the gimbal to the center of the grip of 452mm would provide 12.4inches of grip movement across the arc and would thus perform identically to the real huey's cyclic. However don't forget about the length of the grip itself, with the VKB warbird grip, that's near enough to 100mm from the base of the grip to the center where we would be measuring. So combine that with a 350mm extension and we have our 450mm stick. -
Can we go back to the old flight model for the Huey....
Tim_Fragmagnet replied to StreakerSix's topic in DCS: UH-1H
The yaw control issues are mostly due to the incorrect amount of torque required to hover, yes. However the tail rotor as a whole has been an object of suspect in my research and I'm still not confident with its modeling. As for the controls being twitchy, that's just helicopters in general due to the way they're controlled IRL. A real cyclic has a much larger throw than an unextended flight stick with no curves applied to the axis. Even with a full sized cyclic, pilots still only need to use tiny adjustments in normal cruise operation. I have yet to profile the actual control authority against the real thing but I do have the data to do so. -
Can we go back to the old flight model for the Huey....
Tim_Fragmagnet replied to StreakerSix's topic in DCS: UH-1H
For those who end up not reading all that I've written. I'll sum up this graph extremely simply. That blue plot is the maximum speed you could achieve at 7500lbs in the previous performance model if you absolutely max out its available power even ignoring EGT. That red plot is the maximum speed you could achieve in a real huey with the old metal blades at 7500lbs if you absolutely max out its available power, completely ignoring the safety limit of 50PSI of torque on the transmission. (EGT wasn't really a problem on the real thing) The real thing CAN mechanically go that fast, you're just most likely going to damage or break the transmission by doing it. Additionally, our module uses modern composite blades, which at maximum power provide a top speed of around 10knots higher. The whole point of showing what the maximum achievable speed is, is so that the correct amount of power is required at speeds the real thing would actually fly at. And if you're wondering where I got the max power speed data for the old metal blade huey. It contains many many tables of data Now you might see the Vne of 120 knots and say "it's the Vne, it can't go faster." and to that I say. We clear?
-
reported Huey's new performance profile discussion
Tim_Fragmagnet replied to Tim_Fragmagnet's topic in Bugs and Problems
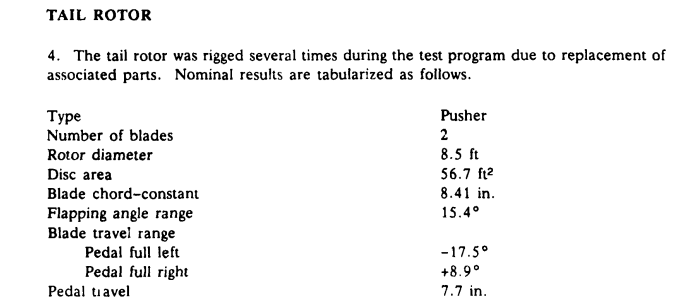
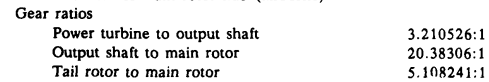
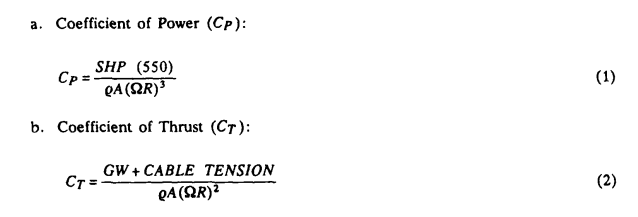
So I've decided to make a set of posts here that are a bit different, educational, if you will. First will be a post explaining the fairly straightforward process someone would go through to correct the performance of this module. (in simple steps) Second will be a post explaining how you would go about profiling the performance of this aircraft entirely by yourself. As a note, this is as much about HOW it would be done as it is about the ORDER in which it SHOULD be done. (if anything the order is the most important part as doing it in some messed up order would make it more difficult) I'm not going to talk about what the flight model parameters actually look like or how the devs themselves would go about fixing it. Just general strokes of "correct this after checking this" So how would we start fixing the performance? Well first, torque calibration should be noted. The torque gauge in the huey was not perfectly accurate, and gave different readings in each huey IRL. However, each aircraft was provided with an engine data plate, this plate included plenty of data, but the one piece we are looking for is the torque calibration factor. How they measured this was fairly simple. What did the torque gauge read at 1125ft/lbs of shaft torque? That's it. Now, if at 1125ft-lbs of engine torque, the torque gauge reads 61.4449346228909 PSI, it would actually be perfectly calibrated. In an ideal world, all hueys would have their torque gauge read this way, but they don't. However this is a simulator. Some huey torque gauges DID read that way. So, calibrating ours to read that way would be a great first step to simplifying the process to fixing the performance. TLDR 1125ft-lbs of shaft torque at 61.4449346228909 PSI of gauge torque would make our huey's power per torque line up with all of the performance metrics. This makes everything easier. So where do we go from there? Next would be correcting the amount of power provided at different engine throttle settings. This graph. After that, we get into the fun stuff. The next step would be correcting the tail rotor. You might be wondering what effect the tail rotor has on the overall performance. In terms of authenticity and accuracy? Quite a lot. The huey's tail rotor can draw upward of 170+SHP at full left pedal. This would change the torque gauge by 8PSI. Yeah, think back to the other graphs and how much 8PSI changes things. First we need to understand how the tail rotor would be set up. How it would be rigged, if you will. It is different for every aircraft, some have less total travel, others have more, but overall the balance should be the same. Blade travel range is what you are looking at here, Pedal full left, provides a blade pitch of -17.5 degrees Pedal full right, provides a blade pitch of +8.9 degrees, yes you read that correctly, PLUS 8.9. Pushing the right pedal all the way in should actually cause the tail rotor to push the nose to the right faster than torque alone can. However, before EVEN THAT, we need to correct something else. The gear ratios. For whatever reason, in DCS the tail rotor to main rotor gear ratio is actually 5.5:1, you can test this yourself easily, the gear ratio doesn't change with RPM. Go hop in a huey, set it to third person, and press the starter Watch how many times the tail rotor rotates in the time it takes the main rotor to rotate once. Fix the gear ratio, then rig the tail rotor. Currently in the DCS huey, the full right position on the pedals actually draws the least power from the engine, this is incorrect. The pedals should be neutralized (producing no thrust, thus drawing the least power) 66% from full left. IE to the right of the center position, but not all the way right. From there the next step would be tweaking how much power the tail rotor draws. 170shp at full left should be sufficient. Additionally, you would correct how much thrust the tail rotor provides in the same way we are about to correct the main rotor thrust, however the tail rotor seemingly doesn't actually produce thrust in DCS, only the relevant torque and anti torque forces. After this would be correcting the lift generated by the main rotor at different power (collective) settings. You might think this would be a difficult metric to determine, however, we have the exact data we need to make this an extremely simple affair. This graph is a performance profiling of the huey in an OGE hover. Out of ground effect means that the performance benefits of being near the ground are not a factor as the hover altitude is high enough that they do not affect the aircraft anymore. This means exactly what you think it does. It means that the amount of thrust generated by the rotor is exactly the same as the mass of the aircraft. A huey at 7700lbs hovering out of ground effect would be producing, you guessed it, 7700lbs of total net downward thrust. This means the chart even takes into account the amount of downward force generated by the rotor pushing air against the body of the aircraft. This graph is an EXACT representation of how much effective thrust the rotor generates for any given power setting. It also includes the position the pedals would need to be in as well. But how do we read this chart? Well, with a little math, of course. I know, don't worry, the math is fairly basic. I know, I know, the symbols look scary, but don't worry, they're just variables like A B C D. Here they are. Allow me to write it out for you. Power Coefficient = ((SHAFT HORSEPOWER*550)/((0.02289013*PRESSURE INHG/(TEMPERATURE C +273.15))*1809.56*(((ROTOR RPM*2π)/60)*24)^3))*10^5 Thrust Coefficient = (TOTAL THRUST IN LBS/((0.02289013*PRESSURE INHG/(TEMPERATURE C +273.15))*1809.56*(((ROTOR RPM*2π)/60)*24)^2))*10^4 As a reminder, our atmospheric test variables are normalized to 15C and 29.921255347142inHg, and the huey tends to spin its rotor at 324rpm. So, in these conditions, a total thrust of 7700lbs would produce a thrust coefficient of 26.99843261, and 780shp would produce a power coefficient of 18.47226921 Check those values on the graph, congratulations, you can now read the graph. From there, it would be adjusting flight model parameters until the out of ground effect performance matched the graph. The rotor would then be producing the right amount of thrust for any given power setting. Then the ground effect parameters would be tweaked so that they could match their respective graphs as well. All 3 graphs are combined on this one. Things get more complicated after this, and I apologize, but I am going to speed up at this point and make it even simpler. With the rotor producing the correct amount of thrust while the aircraft is stationary, next comes correcting the amount of thrust while the aircraft is moving. This is far more complicated as it not only involves dynamic airflow, but also drag. As the helicopter gains speed, the rotor begins to produce more thrust for any given power setting. At 60knots true airspeed the rotor is the most efficient, it takes the least amount of power to keep the aircraft flying at this speed. Effectively, correcting this would just be adjusting the parameters that determine aircraft drag and the amount of thrust gained from forward flight. However, this is not something easily detailed. It is also effectively impossible to profile in DCS as an end user. While, for the hover chart, we could assume that the thrust coefficient was equal to the total weight of the aircraft. This is not the case for forward flight. In forward flight, the thrust coefficient involves an unknown variable we can not reliably obtain, cable tension. In the hover chart, this variable was easily predicted to be zero, however forward flight requires more thrust than the total weight of the aircraft. We cannot determine that in a simple manner. However, the developers should be able to. From there would be correcting the rate of climb per horsepower, however, with all the other parameters corrected, this SHOULD fall into place on its own. Lastly would be correcting the performance at different altitudes, however at this point, you get the idea. Check the data, compare it to how it performs in DCS, adjust the parameters until it's correct. I'm going to take a break and come back at some point with a post about how you can profile all these parameters yourself where possible to the exact same degree that I have done for this thread. Potentially even higher.
- 96 replies
-
- 14
-
-
-
- investigating
- performance
- (and 1 more)
-
reported Huey's new performance profile discussion
Tim_Fragmagnet replied to Tim_Fragmagnet's topic in Bugs and Problems
I don't personally trust the track system for data collection but if you have a use for it, so be it. They aren't the most stable hovers but they're good enough due to how the torque model works. If you need better hovers, I'm sure you have professionals that can do it better than I can. 7500lbs 2ft,5ft,OGE Hover.trk 8500lbs 2ft,5ft,OGE Hover.trk 9500lbs 2ft,5ft,OGE Hover.trk 12000lbs 2ft,5ft Hover.trk 13500lbs 2ft Hover.trk And I'll do one even better. Huey Test 15C 29.92inHg.miz Here is the mission used to run the tests. ANYONE who wants to run these tests to double check me, feel free. There is a trigger to adjust the internal cargo of the huey in kg to achieve the desired weights. The mission defaults to a weight of just over 6500lbs via fuel alone. For weights over those which fuel alone can reach, maximum fuel should bring the aircraft to a total weight of 7438lbs, take whatever your desired weight is, subtract 7438 from it, convert it to kg. then apply it to the trigger. There is no wind and it is at a temperature of 15C and pressure of 29.92inHg (it is unsure if DCS is accurate enough to model 29.921255347142inHg but the difference should be negligable) These are ISA conditions, the exact same conditions used for the IRL huey performance profiling. In short, the only relevant variables are the pilot, and the performance of the aircraft.- 96 replies
-
- 10
-
-
-
- investigating
- performance
- (and 1 more)
-
Flight controls behaviour after the latest update
Tim_Fragmagnet replied to RazorbackNL's topic in Bugs and Problems
For those wondering Takeoff/hovering/landing requires so much more left pedal now because the new performance profile requires an inaccurately large volume of power for these flight profiles. The tail rotor isn't weaker, you just need more of it because the hovering performance is wrong. -
reported Huey's new performance profile discussion
Tim_Fragmagnet replied to Tim_Fragmagnet's topic in Bugs and Problems
I have done a full profiling of the hover performance, and will compile the results into the main post. It's not even close.
- 96 replies
-
- 5
-
-
-
- investigating
- performance
- (and 1 more)
-
reported Huey's new performance profile discussion
Tim_Fragmagnet replied to Tim_Fragmagnet's topic in Bugs and Problems
I have done another performance test, and will compile the graph into the main post. Our huey is generating too much lift at high power settings. This is likely because the drag of the module is so high that to try and improve the accuracy of the speed vs torque metric, the amount of lift generated per horsepower was cranked up. However when doing the rate of climb test, you fly at 60knots TAS, where drag is not much of a factor, just lift. Really, you should just be able to match the rate of climb performance to the real thing by adjusting lift per torque, and then adjusting drag to make the speed vs torque metric more accurate. However I'm not a developer, and have only been researching this aircraft's real performance for a year. You guys have worked with it for a decade, I'm sure you know more than I do. To do this test yourself, create a mission with no wind, and set the weather to 15C 29.92inHg Then on a huey, remove the external hardpoints, add the IR suppressor, max out the fuel, and then with a mission trigger, add 119kg of internal cargo to match the 7700lbs test weight. Then fly the huey at 60knots true airspeed at different torque settings.
- 96 replies
-
- 8
-
-
-
- investigating
- performance
- (and 1 more)
-
reported Huey's new performance profile discussion
Tim_Fragmagnet replied to Tim_Fragmagnet's topic in Bugs and Problems
I realized I should probably cite my sources. null You'll notice the operator's manual is not included. That is because the data within the operator's manual is derived from documents like these. The data in the operator's manual is superseded by these documents in regards to absolute performance profiling. I HIGHLY recommend reading Helicopter Drive System Load Analysis, absolute thriller. Edit: looks like I forgot one. Page 21? Absolutely R I V E T I N G.
- 96 replies
-
- 8
-
-
- investigating
- performance
- (and 1 more)