RealDCSpilot
-
Posts
1373 -
Joined
-
Last visited
Content Type
Profiles
Forums
Events
Everything posted by RealDCSpilot
-
Question: is the extreme wind setting on purpose? I enjoy training on havoc servers alot, but this always feels a little overkill...
-

Source of performance problems
RealDCSpilot replied to RealDCSpilot's topic in Game Performance Bugs
With "simple" i meant the approach of fixing the problem by simply removing assets from the mission. The problem still exists. Just checked the F5E Agressors campaign and the performance gain is only marginal. The initial parking position is changed, but as soon you are facing a couple of the other parked planes, performance starts to drop heavily. -
Source of performance problems
RealDCSpilot replied to RealDCSpilot's topic in Game Performance Bugs
@some1 Just tested this, disabling wake turbulence helps a little, but not that much. As soon the simulation value shoots over 18, frametimes rise extremely and FPS drop hard. Good benchmark scenarios are those WWII bomber formation attack missions. -
Source of performance problems
RealDCSpilot replied to RealDCSpilot's topic in Game Performance Bugs
"Removed unused units and replaced them with static models" I guess that's the simple "fix" for the Aggressors campaign missions. Those parked jets aren't idle AI's anymore. -
Source of performance problems
RealDCSpilot replied to RealDCSpilot's topic in Game Performance Bugs
@Minsky Some issues got fixed yes. The spawning of AI groups in the FPS AI mission doesn't tank performance anymore. But the bomber formation test scenario: https://forums.eagle.ru/showpost.php?p=4243909&postcount=202 still tanks my performance extremely. The simulation value shoots up to over 80 and my frames drop from 45 to 10 or lower. -
[REPORTED]VR Performance OB 2.5.6
RealDCSpilot replied to Gripen 4-1's topic in Game Performance Bugs
The game did run very well last year...
-
Source of performance problems
RealDCSpilot replied to RealDCSpilot's topic in Game Performance Bugs
Actually it's the other way around, 1 draw call can be one object, a predefined group of objects or just a per pixel color change render pass that adds 33% red on every pixel on the entire screen. Usually a significant number of dynamic objects is used for assembling a interactive 3D world, so the CPU to GPU calls matter especially on objects, because the more are called the more significant their impact will be on performance. Thats why the object count is displayed in the FPS info. About the simulation value, well it's the point of the whole thread that you are missing completely. Again, if you really want to analyze something, check this mission with your fancy graphs: https://forums.eagle.ru/showpost.php?p=4238222&postcount=188 And look for the connection between simulation value and massive increase of frametime. -
I recommend reading about particle effects in game engines to understand what you see there. The black smoke uses textures with black pixel clouds at high transparency settings. Currently they seem to use too much particles of it with a costly blending mode to achieve it's visual effect.
-
Source of performance problems
RealDCSpilot replied to RealDCSpilot's topic in Game Performance Bugs
@Worrazen If you add DCS's own performance stats with Ctrl+Alt+Pause (twice for full) you might understand what i mean with "number of objects" aka draw calls and "Main: Simulation" etc. it even has a polygon counter. You also may read the whole thread again. If you really want to deeply analyze the problem, check this .miz file: https://forums.eagle.ru/showpost.php?p=4238222&postcount=188 (might be pretty interesting on the graphs!) -
@Pikey Shaders are rebuild during loading, when dcs is started or loading a scenario.
-
[REPORTED]VR Performance OB 2.5.6
RealDCSpilot replied to Gripen 4-1's topic in Game Performance Bugs
I also see no performance gain from the VR shader mod. It may have some effect on lower end systems, but on my end i only see that NVG peeking feature as useful. I have my doubts about how this black mask rendering makes any sense, because if it's added later in the pipeline, those covered pixels are rendered anyway and turned into black in an additional step. What has an effect on FPS is Nvidia driver settings and turning DCS settings down, like he did in the video. But that doesn't help with how AI units tank performance afterwards. -
On my side it's not the shaders, it's AI units. They pull to much CPU frametime. In an empty map, FPS are normal. The VR shader mod didn't change anything at all. Maybe it works for lower end systems, or is just a placebo and lowering game settings does the real job in those cases.
-
Could the lower FPS after 2.5.6, be because of windows version 1909?
RealDCSpilot replied to GVO's topic in Virtual Reality
If you are testing FPS, try a free flight in an empty map first (with mission editor). Check FPS and then try a mission with AI units. -
I just tested a simple scene in the editor, 20 Bf 109's on a turning point besides the airport and me starting from the runway in a christen eagle. Framerate was tanked right from the beginning, simulation value was extremely high (around 80) frametime also extremely high (around 70). When i left the area and was around 10 miles away, the frametimes started to get better but still to high to hold 45 fps (30 fps, VR with forced motion smoothing).
-
Source of performance problems
RealDCSpilot replied to RealDCSpilot's topic in Game Performance Bugs
Thanks to Knock-Knock, this shows the problem at best: https://forums.eagle.ru/showpost.php?p=4238222&postcount=188 -
Source of performance problems
RealDCSpilot replied to RealDCSpilot's topic in Game Performance Bugs
The number of objects, my hyperintelligent friend... -
Source of performance problems
RealDCSpilot replied to RealDCSpilot's topic in Game Performance Bugs
Thanks to Minsky https://forums.eagle.ru/showthread.php?t=265686 for making USSR_Rik aware. Minsky's info is much better, in his screenshots you can see low drawcalls vs. an increase of "Simulation". -
Source of performance problems
RealDCSpilot replied to RealDCSpilot's topic in Game Performance Bugs
Hmmm, i'm running an i9 10920X with hyperthreading disabled (12 real cores). After watching DCS's load on the CPU i used process lasso to restrict DCS affinity on these 3 cores. Later i used the extended FPS view in DCS to see whats going on in the "Main:" line, which lead me to the conclusion that the value behind "Simulation" maybe the source of the problem. So i came to the conclusion, that something that is calculated on the main thread is increasing CPU frametime making the GPU wait by taking too long. So there is definitely no more cost on the GPU (indicated by low usage). @Worrazen ??? In the multiple testing sessions i used the Huey to circle around those parked planes and then turned away from them to watch the FPS go up again as soon they are out of my FOV. I even build a replica in the mission editor to see the same happening on the other 3 maps as well. However, it's not my job to analyse deeply whats going on there. The info should be enough for ED to know where to look for. -
Source of performance problems
RealDCSpilot replied to RealDCSpilot's topic in Game Performance Bugs
@(504)Blade i'm currently back on 2.5.5 and face the same problem, but it tanks performance not as hard as 2.5.6. In 2.5.5 fps drop from 45 to 30 which is already extreme, in 2.5.6 it drops from 45 to ~20. When i look at the built-in FPS counter, the Simulation value of the main thread seems to be related to the fps drops. Might be a calculation that is taking too long and slowing down the CPU. My GPU usage shows that there is still headroom for more work, but the CPU is unable to deliver in time. -
Source of performance problems
RealDCSpilot replied to RealDCSpilot's topic in Game Performance Bugs
@-0303- Holy ... much respect for bringing a C-64 to battle! ;) -
The more concerning value on all these screenshots is "Simulation" on the main thread. In my tests this value has the biggest impact on framerate. Sometimes it's crazy going up and down, what is this? Physics calculations?
-
Source of performance problems
RealDCSpilot replied to RealDCSpilot's topic in Game Performance Bugs
There is definitely something wrong with AI units, the CPU might be doing extra or doubled but unnecessary calculations. Or it's a deep implemented, but bad concept of code in DCS. -
Source of performance problems
RealDCSpilot replied to RealDCSpilot's topic in Game Performance Bugs
I just tested recreating the same scenario in the mission editor. Just put some groups of AI units on an airflied and visit them after that. -
Made no difference on my end. By the way, image sharpening does not work in the HMD it only affects what is displayed on the monitor. Texture filtering to high performance instead of high quality can free some extra frames and VR prerendered frames to higher than 1 may help reducing reprojection artifacts (motion smoothing etc.).
-
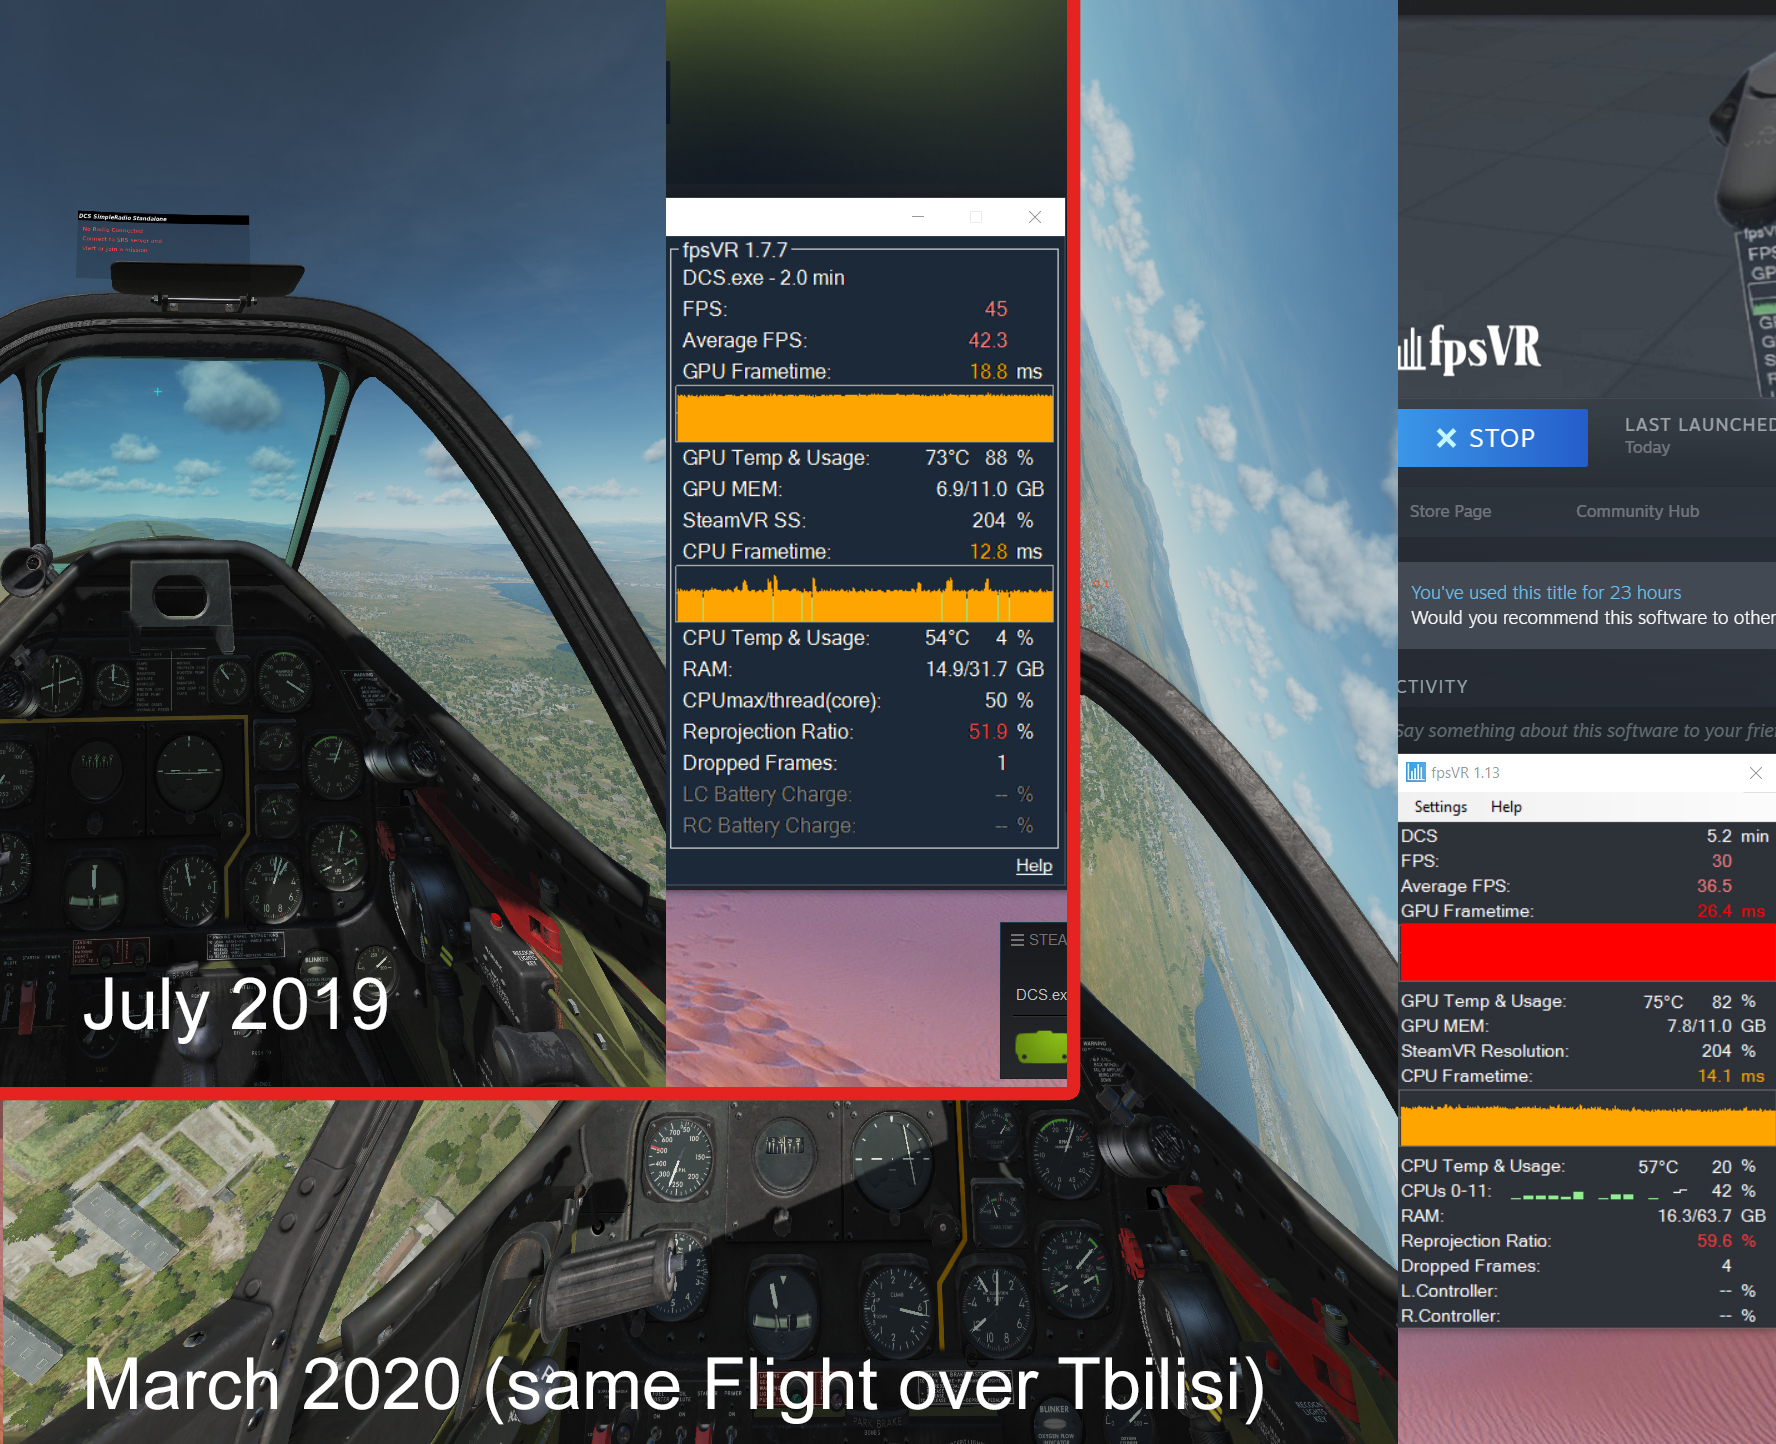
I have a pretty beefy machine and can run DCS at insanely high settings in VR, i can hold stable 45 fps without problems in OB 2.5.5 or 2.5.6 ... The only reason for heavy performance drops on my end are AI objects in vicinity, it's not the new shaders or eye candy. Modern GPU's (1080 - 2080ti) eat pixelshaders for breakfast, so it's definitely not the "new lighting". Please ED, focus all of your optimization at this particular matter! It's been there for years and slashes back everytime! There is no mission or campaign i can play in this state. In 2.5.6 my fps drop from 45 to 20 in the same scenario. Check those screenshots (made in 2.5.5 latest OB)
.jpg.f4c4212d25669a6b0bb60598ef5c8b53.jpg)
.jpg.b7573264d5f69ca995c61618a11918a9.jpg)
.jpg.2eb4a276b64fc2dd8e7c1e475d6aa3c0.jpg)
.jpg.f0e106b4234ee430f27c6f96f55e833c.jpg)
.jpg.b79ab3a92e1fe11c7cdfa4f6f6af9b01.jpg)
.jpg.7d5eb6153da3aee7053012d982ba05cf.jpg)