Search the Community
Showing results for tags 'benchmarks'.
Found 6 results
-
Right now, everyone measures performance in completely different ways — with different missions, modules, and settings — which makes it nearly impossible to compare results or provide meaningful feedback. With an integrated benchmarking system, we could all test under the exact same conditions. Why this matters for players We could finally find the optimal hardware and graphics settings for our rigs without guesswork. We’d have a reliable way to compare upgrades (e.g., “Will a 9950X3D really outperform my 9800X3D in a heavy mission?”). Squadrons could make sure everyone has a smooth experience before big multiplayer events. Why this matters for ED Consistent performance data across thousands of users would make diagnosing and prioritizing performance issues much easier. It would help separate true “bugs” from cases where users just have mismatched settings. It could even serve as a tool for measuring improvements with each patch and verifying optimization progress. Example Benchmark Scenarios GPU Test: Empty map, no units — great for isolating GPU performance. Mixed Scenario: Moderate number of ground units and some AI aircraft — balanced test. Full Stress Test: Large-scale battle with lots of AI, explosions, and scripting — perfect for CPU benchmarking and mission-load testing. Having this tool would give ED a goldmine of telemetry data and would give us players confidence that we are making the most of our hardware. It could even be automated to submit anonymized results, helping ED continuously improve performance. I think this would be a win for everyone — players get clarity, ED gets better data, and DCS gets even closer to being the ultimate combat flight sim. Thanks
- 9 replies
-
- 4
-

-
- performance
- benchmarks
- (and 1 more)
-
Interesting video on benchmarking in DCS
-
I have been lucky enough this week to be able to compare the 5080 FE with the 5070ti (MSI Ventus x3 OC). Setup A 9800x3d with a x870 motherboard (Asus), 64Gb DDR5 RAM at 6000Mhz, a 2 Tb Lexar EQ790 NVME drive (game drive). The CPU has a liquid, three-fan cooler. When comparing the two cards all settings are the same. DCS settings are at the bottom. The cards were compared at stock clock speeds and with overclocking (MSI afterburner). Stock OC Core Boost Mem Core Boost Mem 5070ti 2295 2482 1750 2695 2882* 2000 5080 2295 2617 1875 2695 3017* 2125 *Actual clock speeds were close to 3200MHz for both cards during testing. For comparison here are the 3DMark scores: 5070ti (stock) 5070ti (OC) 5070ti (%) 5080 (stock) 5080 (OC) 5080 (%) Steel Nomad* 6273 6745 107.5% 8050 9020 112.0% Fire Strike# 67955 72704 107.0% 78293 83752 107.0% *Average of 4-6 runs, #graphics score Quest Pro with Meta link cable at 72Hz and base resolution (1808x1856 per eye). QVFR smoothen_focus_view_edges=0.1 sharpen_focus_view=0.9 horizontal_focus_section=0.25 vertical_focus_section=0.25 peripheral_multiplier=0.8 focus_multiplier=2.2 Equivalent resolutions (if applied to the full screen) Base 2.2 0.8 Horizontal 1808 3978 1446 Vertical 1856 4083 1485 The test run was the instant action mission “Free flight over Syria” in the F-16. I used “XRFrameTools by Fred Emmott to capture single frames over a 1-minute period (4300 frames). XRFrameTools/README.md at main · fredemmott/XRFrameTools. Data recorded: CPU render time GPU render time VRAM use (current) FPS The results were extracted to a spreadsheet and used to calculate average values (plus min/max) and the number of missed frames (those that exceeded 13.9 ms; (1000/72 = 13.89 ms)). This is shown as the red dotted line in the charts. The charts represent the number of events occurring in 0.1 ms bins from 0 to 20 ms, displayed as a percentage of the total frames. What this shows is the distribution of frame times and the consistency across the track. Ideally, these should look tall and narrow to represent consistent frames times. Results The blue traces show the results for the 5070ti. Base clock (open). Overclocked (filled). The green traces show the results for the 5080. Base clock (open). Overclocked (filled). GPU render times were 2 to 2.6 ms faster (approx. 28-32%) for the 5080 vs the 5070ti. Overclocking for each card produced a 7-8% reduction in GPU render times, and a more consistent distribution (narrow and taller). The stock 5070ti was pushing the 13.9 ms boundary which could lead to missed frames and stutter. The CPU render times were essentially the same for each run. f-16 Syria f-16 Syria f-16 Syria f-16 Syria 5070ti (base) 5070ti (oc) 5080 (Base) 5080 (OC) CPU mean 4.12 4.04 4.09 4.06 CPU median 4.09 4.01 4.04 4.01 CPU min 3.37 3.16 3.31 0.24 CPU max 7.48 6.80 6.74 8.93 GPU mean 10.65 9.49 8.05 7.47 GPU median 10.58 9.42 7.97 7.34 GPU min 8.03 7.07 5.85 0.21 GPU max 14.00 13.22 11.21 13.66 VRAM mean 7.11 7.26 6.93 7.60 VRAM median 6.88 7.27 6.97 7.52 VRAM min 6.13 7.12 6.54 7.29 VRAM max 7.83 7.32 7.01 7.85 Events 4229 4229 4214 4214 Missed 1.00 0.00 0.00 0.00 % missed 0.02% 0.00% 0.00% 0.00% FPS 72.2 72.1 72.1 72.0

- 27 replies
-
- 4
-
-

-
- vr
- benchmarks
- (and 2 more)
-
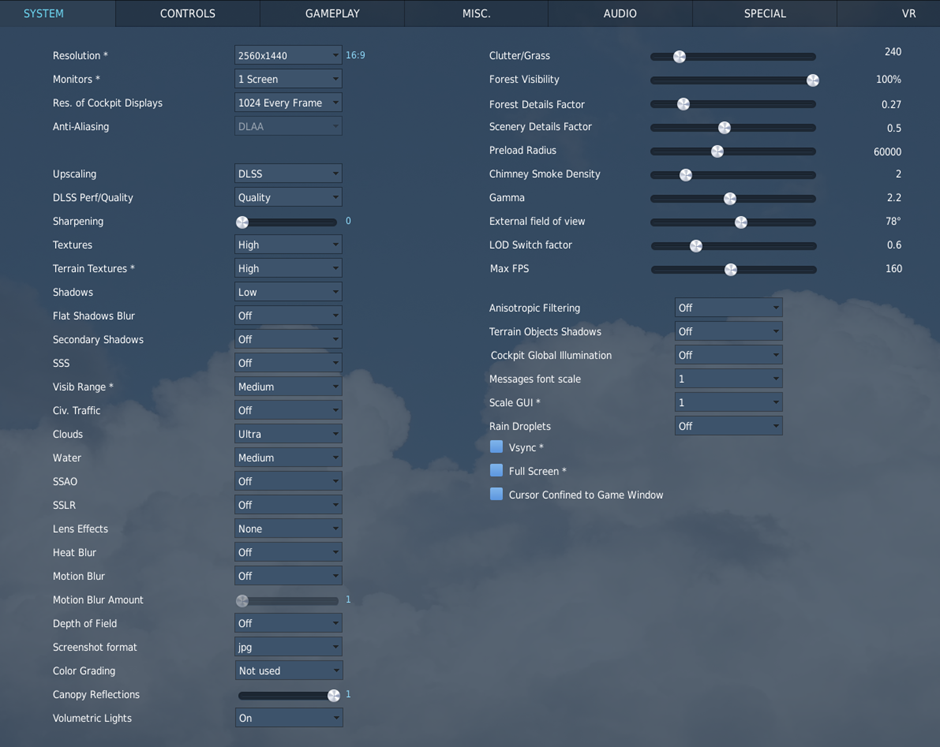
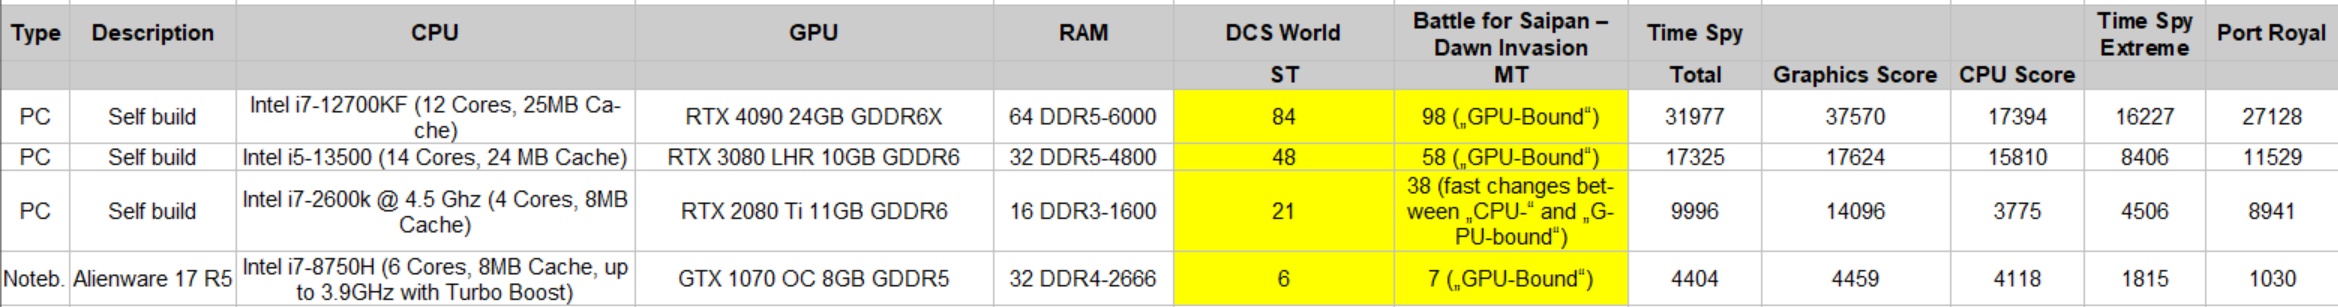
 I have done several performance tests of my newest hardware and compared them with each other. I have used DCS World 2.8.3.38090 Open Beta with Single Thread ST and Multiple Threads MT with an Instant Mission: AH-64D, map "Marianas" - Battle for Saipan: Dawn Invasion" After starting the mission, I have pressed OK, then [Right-STRG + Break/Pause] for two times (for displaying the frame rate) and then I have pressed the space bar. Directly after that I have checked the frame rate. I know that my graphic settings are very hard.....: null All CPUs as well as GPUs are slightly overclocked, except the CPU Intel I5-13500. Here are the results, including the fps / framerates in DCS World with ST and MT: Here as a table: 4K performance comparison between four of my computers Type Description CPU GPU RAM DCS World Battle for Saipan – Dawn Invasion Time Spy Time Spy Extreme Port Royal ST MT Total Graphics Score CPU Score PC Self build Intel i7-12700KF (12 Cores, 25MB Cache) RTX 4090 24GB GDDR6X 64 DDR5-6000 84 98 („GPU-Bound“) 31977 37570 17394 16227 27128 PC Self build Intel i5-13500 (14 Cores, 24 MB Cache) RTX 3080 LHR 10GB GDDR6 32 DDR5-4800 48 58 („GPU-Bound“) 17325 17624 15810 8406 11529 PC Self build Intel i7-2600k @ 4.5 Ghz (4 Cores, 8MB Cache) RTX 2080 Ti 11GB GDDR6 16 DDR3-1600 21 38 (fast changes between „CPU-“ and „GPU-bound“) 9996 14096 3775 4506 8941 Notebook Alienware 17 R5 Intel i7-8750H (6 Cores, 8MB Cache, up to 3.9GHz with Turbo Boost) GTX 1070 OC 8GB GDDR5 32 DDR4-2666 6 7 („GPU-Bound“) 4404 4459 4118 1815 1030
-
- 6
-
-
-
- multithread
- hardware
- (and 16 more)
-
So I created a track file and benchmark 'procedure' to yield results that can be compared against each other. I also created a YouTube video to demonstrate how I use it. https://youtu.be/6y5n0uewpsE The Track file and my bench mark results are all captured in 4K. The settings I used for all the benchmark runs are; This is a list of benchmarks run using the above setting and the track file in case anyone wants to compare results. Going to be curious when Vulkan arrives. Benchmark Run.trk
- 18 replies
-
- 7
-
-
-
- benchmarks
- benchmarking dcs
- (and 4 more)
-
 Hey guys. Another topic about "building a new PC". My question is whether the VGA I'm choosing will work for what I want. My intention is to play at 2K and the setup I'm building is this: - i7 12700K - Gigabyte B660M Aorus PRO - 64GB (2x32GB) Kingston Fury Beast, 3200MHz, DDR4, CL16 - SSD 2 TB Kingston Fury Renegade, M.2 2280 PCIe, NVMe, 7300 / 7000 - Screen Asus TUF 31.5 LED 2K QHD, Curved, 144Hz, 1ms, VG32VQ with TIR 5 Most of the time I play multiplayer. Now the question: will an RTX 4070 Asus OC Edition NVIDIA GeForce, 12 GB GDDR6X, be able to run at 2K on a 31.5" screen with more than 60fps in multiplayer? Thank you for the patience. Seeya!
.thumb.jpeg.e9a5eea36533302653032ca510164dc5.jpeg)