.jpeg.1950dad3c75d21c1e43ee8f6dca04d62.jpeg)
.jpeg.7752bfbe76ec20e31515648c85b7b615.jpeg)
Qcumber
-
Posts
2221 -
Joined
-
Last visited
Content Type
Profiles
Forums
Events
Everything posted by Qcumber
-
Have you tried using the meta link app instead of VD?
-
Anyone remember this? Nostalgia while we waited for the Germany map.
- 1 reply
-
- 3
-

-
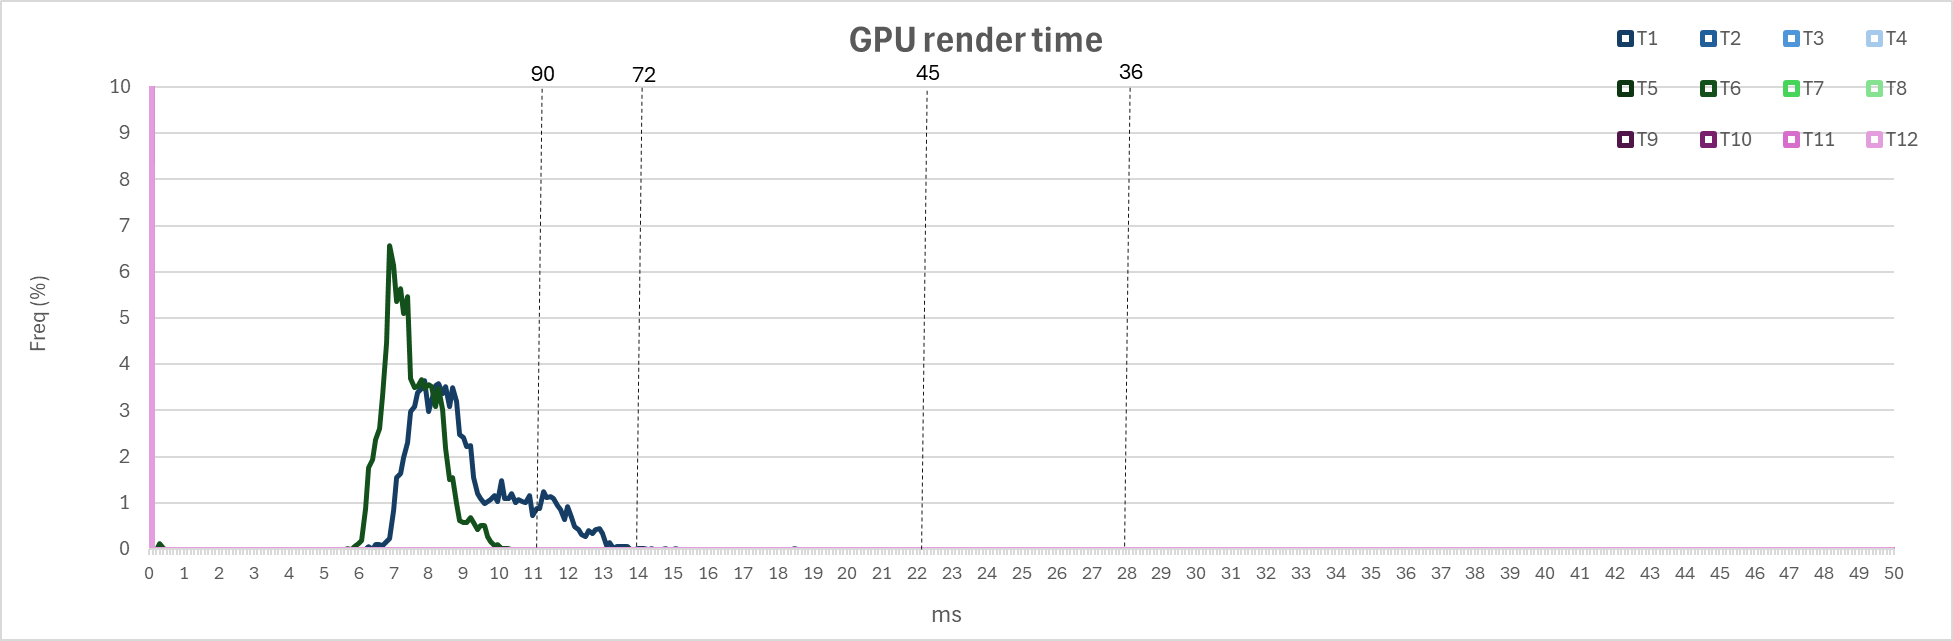
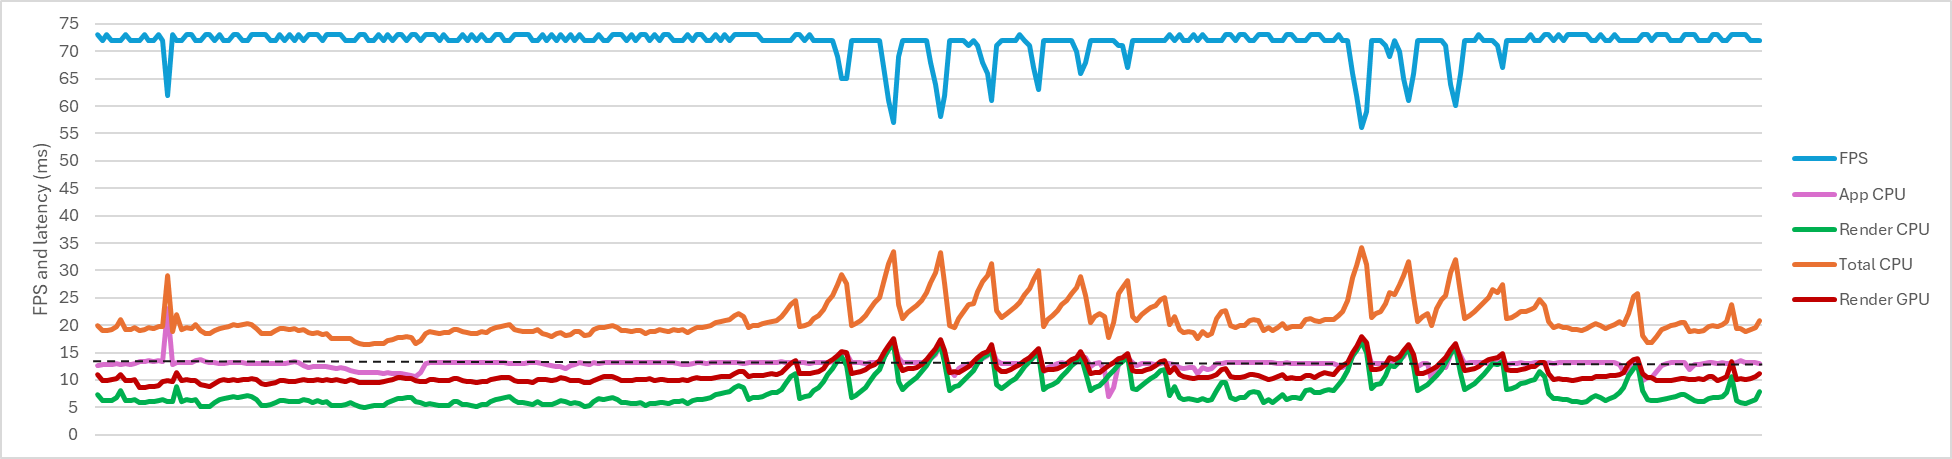
UPDATE 13 April 2025 The spreadsheet has been updated as follows: Maximum latency now 50 ms for CPU and GPU charts' FPS count CPU render and GPU render over time added. Vertical lines added to represent 90, 72, 45 and 36 FPS respectively (the last 2 relate to reprojection at 90Hz and 72Hz). [The updated file is in the first post] The charts now look like this:

-
To follow on from speed-of-heat, and with regards your headset, could you please post details of you VD settings? Ideally a screen shot of the in-game overlay so we can see your latencies ect. What do your CPU and GPU frametimes look like? Are you using QVFR?
-
I'll update it later so that it has up to 50 ms then set all the charts to the max value. Then it will be standardized for reprojection frametimes too. I probably won't get chance until this evening UK time though.
-
You could send me a recorded track then I can try running it on my PC. See if I get the same issues.
-
I wonder what the 5060ti 16Gb will look like in DCS. Might be a consideration instead of the 5070.
-
Yes. Just go into the chart and increase the data range for that sample. I think I have included up to 50ms. If no then I can always update the blank spreadsheet and repost it.
-
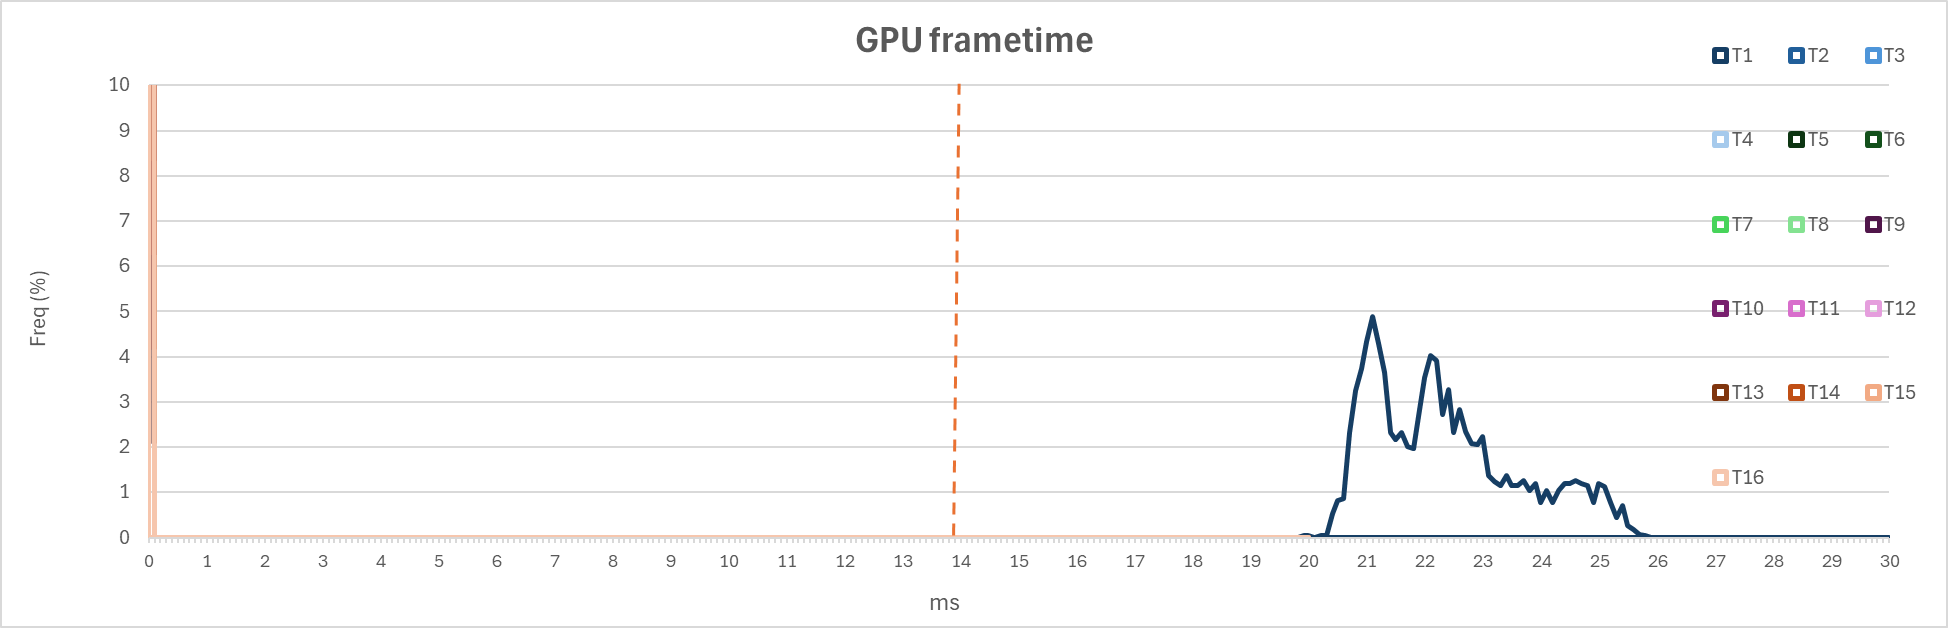
The GPU frame times are longer than 20 ms so they were not showing. I have extended the chart to 30ms. I've updated the SS for you. What DCS settings are you using and what is the module/map/track? ColdViPer benchmark.xlsx
-
What is the module and map? If you send me the track I can try running it and see if I get the same issues.
-
I'm not sure. It could be. Try running a track without it.
-
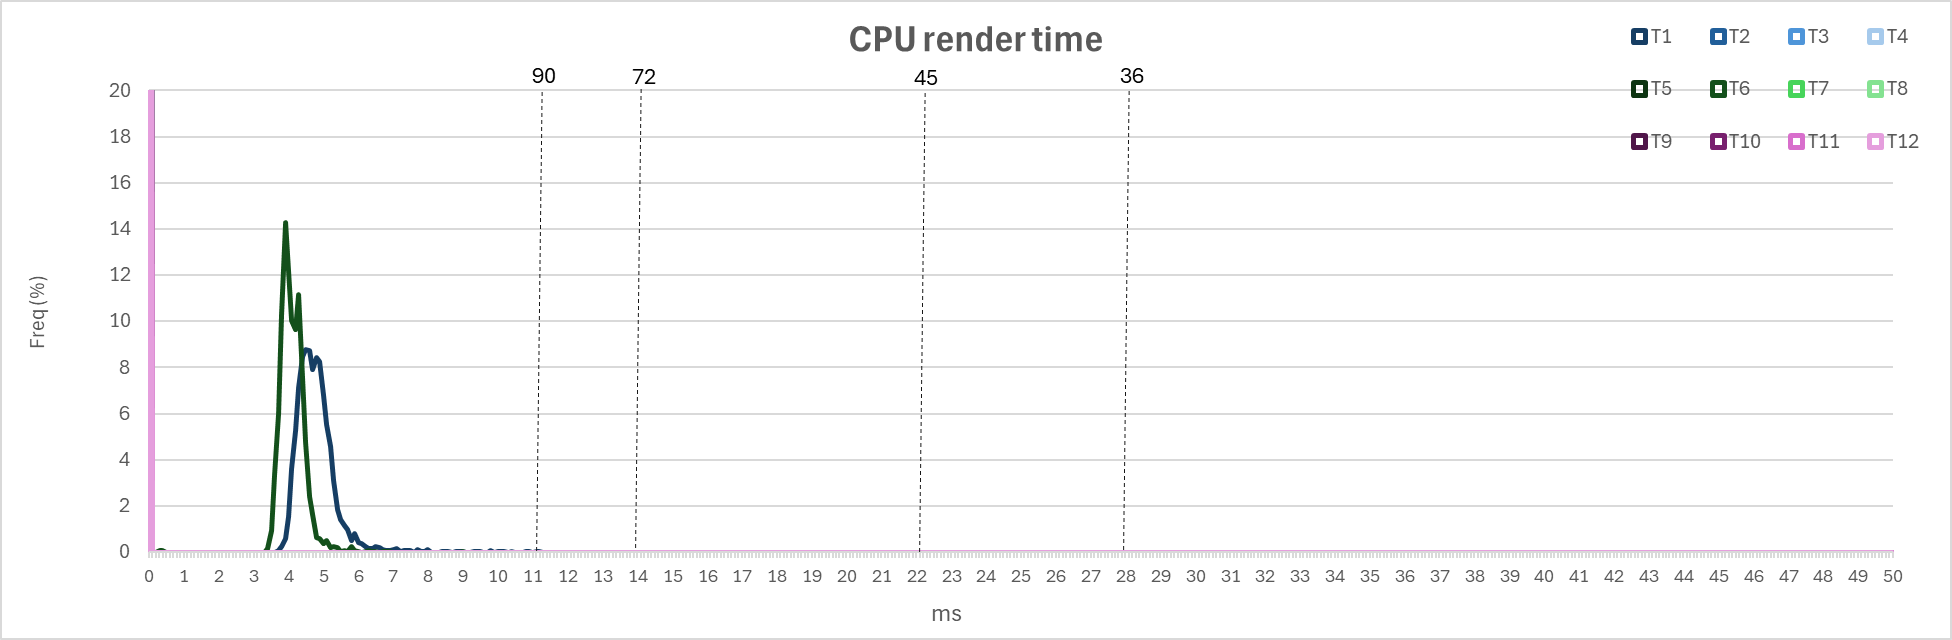
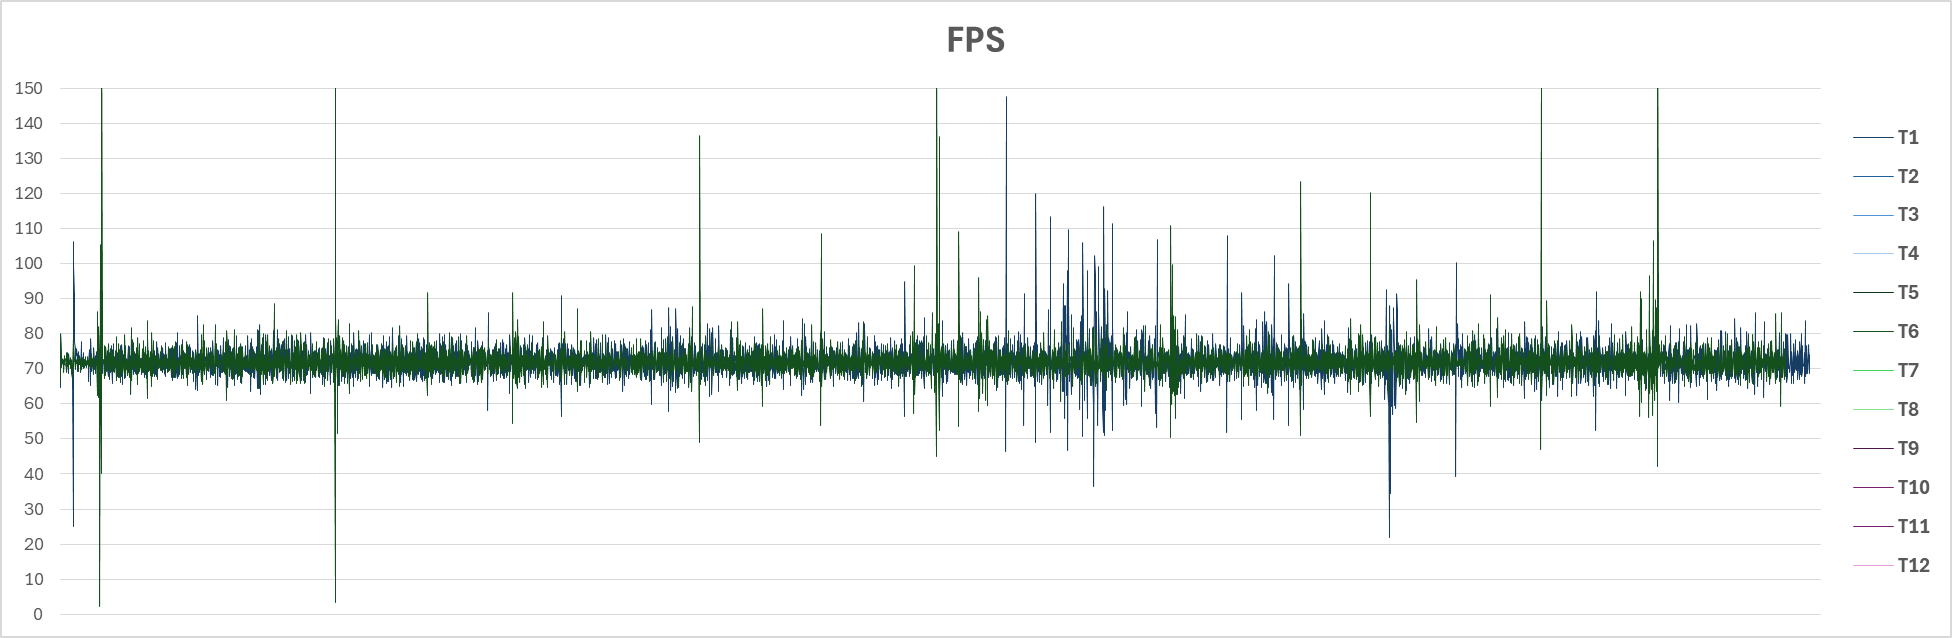
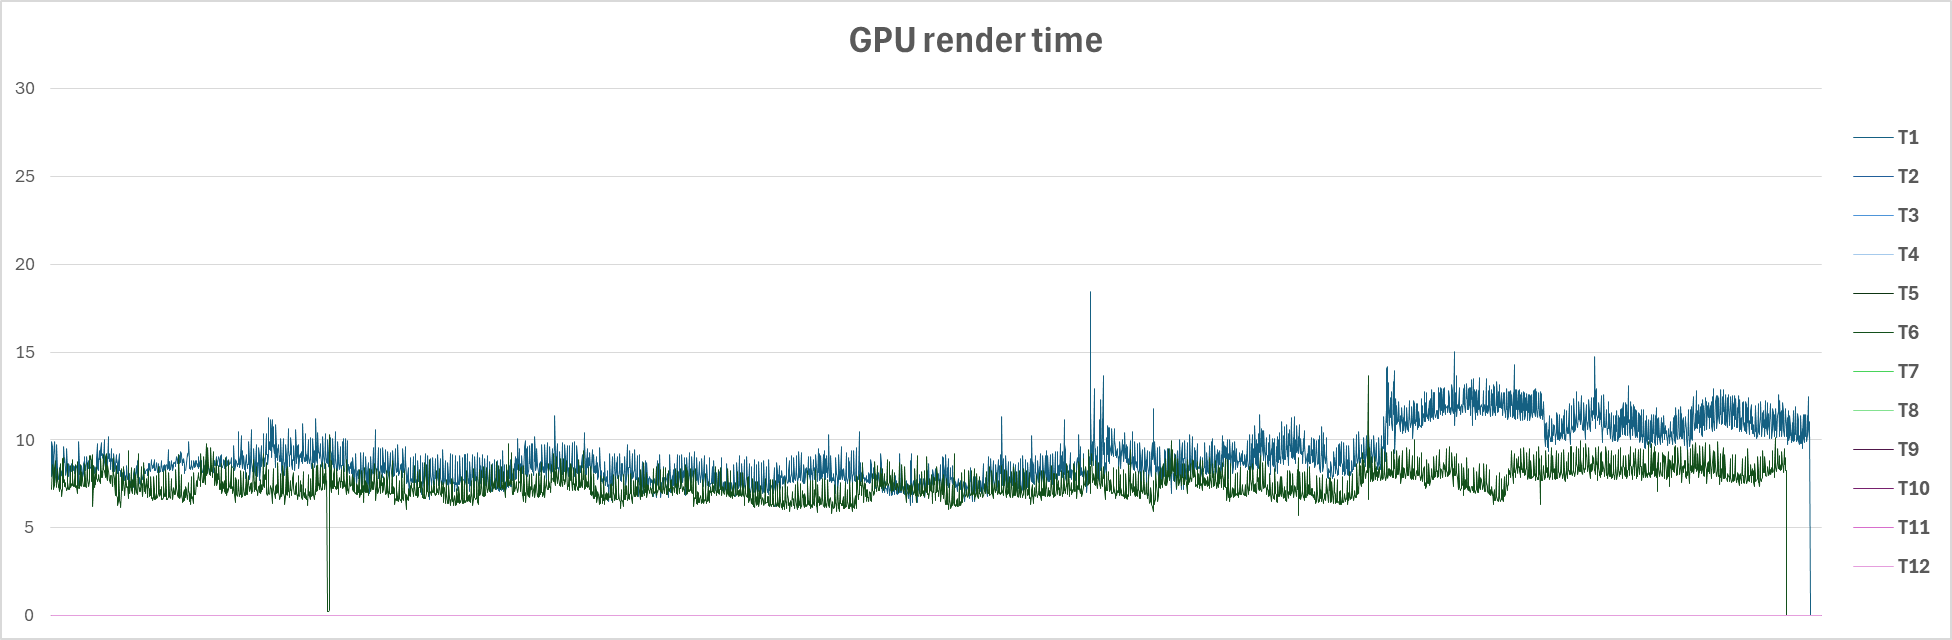
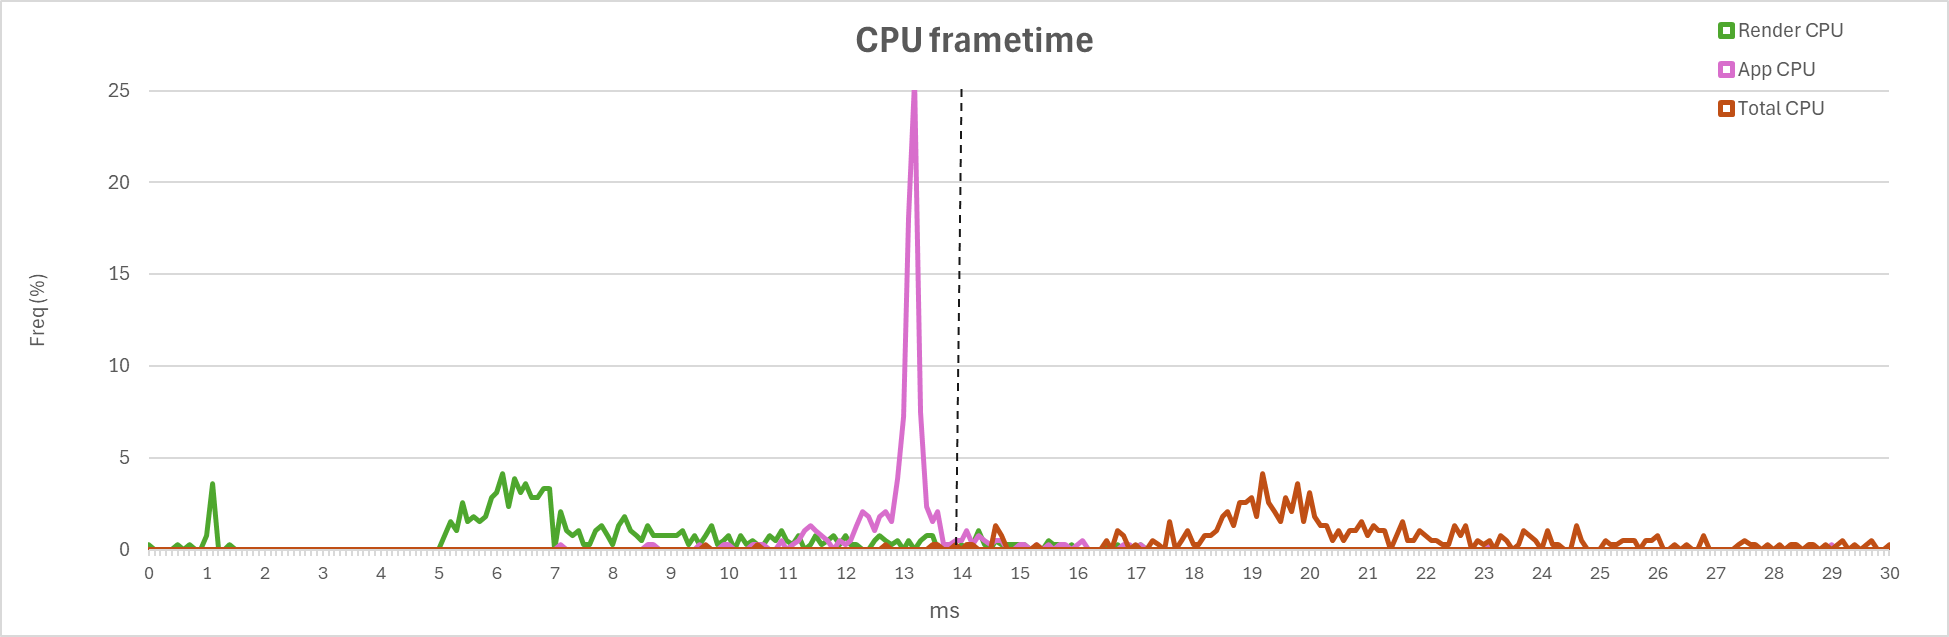
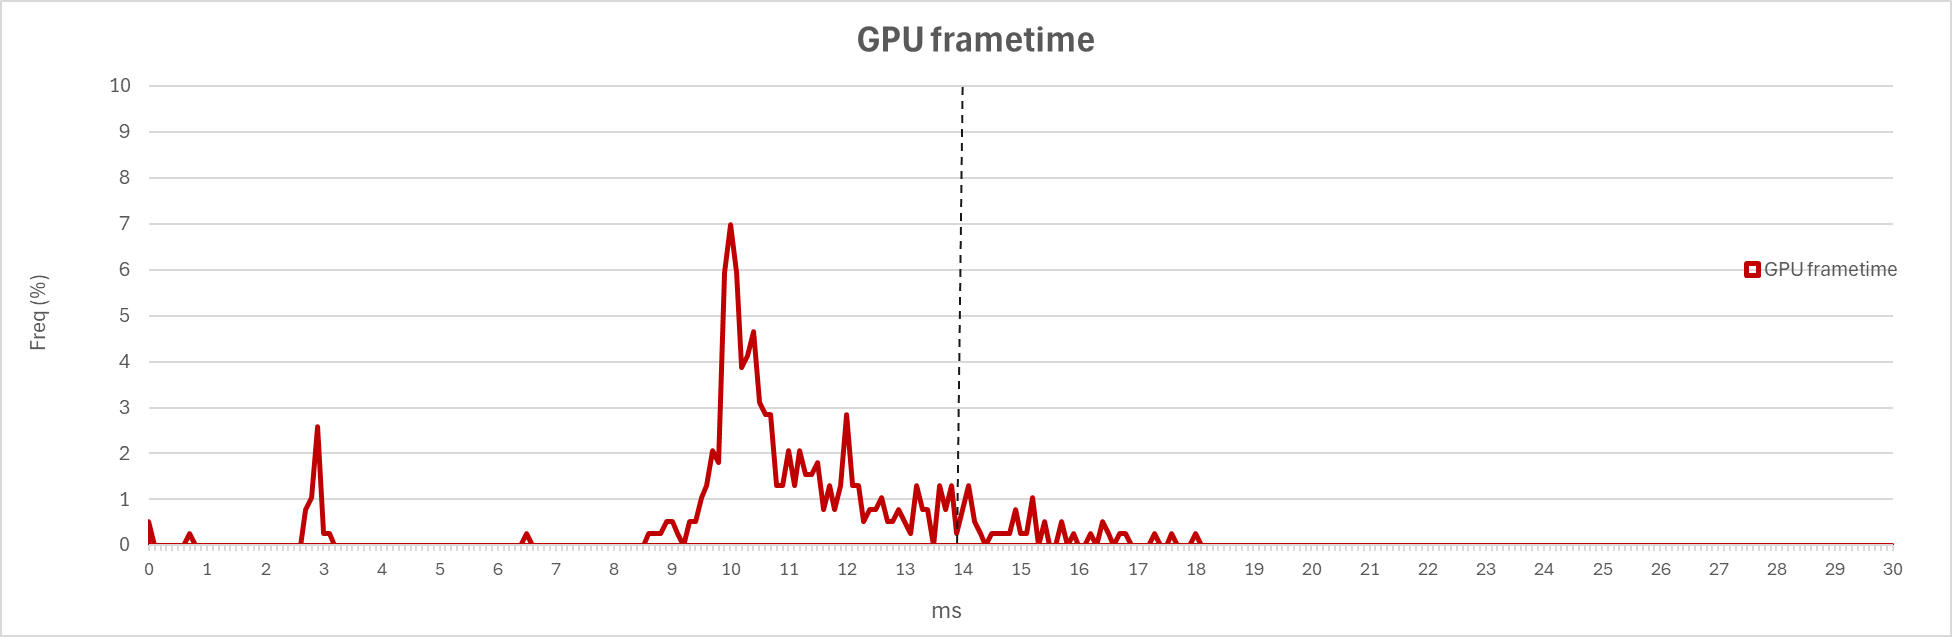
Thanks. I have had a look at this. These are plots of your frame times and FPS. Firstly your GPU performance. The mean latency is 10.8 ms which is well below what you need to maintain 72 fps. However there is a demanding part of the track which pushes the latencies higher than 13.88 ms resulting in about 10% missed frames (everything right of the black dotted line). This may not be noticeable in average FPS count but can be seen as stutters. Next the CPU frametimes. As I said earlier App CPU is normally very low. Below are plots from both App CPU and Render CPU times and the total CPU time. The App CPU time is consistently grouping around 13ms. The render CPU time is all over the place between 5 and 16 ms. Combined this gives a mean CPU time of 21 ms which is very high. Finally a chart showing the latencies and FPS over the whole track. I have edited out the start and end as these artifacts presumably as you started and stopped the recording. The GPU render times are good for the first 20s or so (around 10-11 ms so well below the magic 13.88 needed to maintain 72 FPS (horizontal black dashed line)). App CPU time is around 13 ms. As I said above this is normally low (1-3 ms). It is the time needed for DCS to process the information before it can be rendered and sent to the GPU. The middle of the track appears to be very heavy on both your GPU and CPU as there are periodic spikes in both GPU and CPU frametimes and corresponding drops in framerates. This suggests to me that your hardware cannot handle the DCS settings. So what next? I would suggest reducing DCS settings to as basic as possible and run a track with a simple module over a non populated part of Caucasus above 10000 feet. Keep clouds to a minimum. This should then show if it is a limitation of your hardware or if is something else.
-
Are you using link cable? If so then the max bitrate is 960 mbps. Try increasing to this and see if it works OK on your system. I think setting to 0 is default but I can't remember what that is. I presume that you mean Open XR Toolkit? Open XR is the API through which DCS and the Meta app communicate.
-
Just try disabling Turbo in QVFR and OXRTK for now. You can still then record the stats.
-
.thumb.jpeg.e9a5eea36533302653032ca510164dc5.jpeg) I really hope they do. With a possible extension across the Netherlands to the east of England. That would make long range missions to Berlin possible.
I really hope they do. With a possible extension across the Netherlands to the east of England. That would make long range missions to Berlin possible. -
Yes. Good point regarding QVFR. This could have Turbo enabled which would mess with OXRTK stats. I am using the latest NVIDIA driver with the 5080 with no issues. From what I have read, most issues with 50xx GPUs are related to early versions of the 572 driver. Or using 40xx or 30xx GPUs.
-
You need to get a direct download. Here is the thread I started with Fred on GitHub. Hopefully that link will work ok. Just use this version for the log conversion not the capture. https://github.com/fredemmott/XRFrameTools/issues/34#issuecomment-2737326559 XRFrameTools is still in "alpha" but hopefully there will be an update soon so that this issue is fixed.
-
I'm not sure what the issue is but something is messing with the render time measurements.
-
Something isn't right with those render times. The AppCPU should be very low, but it showing as about about 7-12 ms and sometimes a lot higher. The render CPU and render GPU should be in the 7-14 ms range but they are showing as about 15-200 microseconds. Did you run these without turbo mode enabled? Have you got any other mods enabled?
-
An alternative method for capturing the data is to use the OXRTK "Record statistics" function. This is at the bottom of the first tab. Enable "High Rate Statistics". The log file is created here: %LocalAppData%\OpenXR-Toolkit\stats This is an easier method but only gives you an average of about 7-8 frames at 72Hz. The spreadsheet will need adjusting accordingly using this method. Overall I prefer the XRFrameTools method as it captures every frame.
-
Yes. The advanced overlay. In the first tab of OXRTK there is a function at the bottom that allows you to record. This is the saved as a CSV file that you can then open in excel or Google sheets. Just run it through an episode where you get the problems and another when it is more stable and then we can see what is happening to the render times.
-
So far I have just done a simple overclock of the 9800x3d using Ryzen Master. And the MSI afterburner overclock I mentioned above. Nothing at BIOS level yet. I am testing an MSI curve overclock at +415 with a cap at 1000mV/3200Mhz. So far it is stable and still gives me a decent performance boost. If it helps I can post my results from 3d mark.
-
I am starting to get some very good results with the 9800x3d and 5080. 72Hz is overall probably the best option but I have been getting some surprising results at 90Hz. I need to do more testing then I will post.
-
I have made a new post with my methods and spreadsheet.
-
I have just posted my spreadsheet and workings here. I am very happy to collaborate. Try to find some way of standardising the benchmarking in VR. Any suggestions on developing and streamlining the workflow would be very much appreciated.