.jpeg.1950dad3c75d21c1e43ee8f6dca04d62.jpeg)
.jpeg.7752bfbe76ec20e31515648c85b7b615.jpeg)
Qcumber
-
Posts
2221 -
Joined
-
Last visited
Content Type
Profiles
Forums
Events
Everything posted by Qcumber
-
How does it run through VD? Any better?
-
Try detaching the rear pad, turn it upside down and reattach. This helps support the weight more on the top of your head and allows your eyes to get a bit closer to the lenses. I find it quite comfortable but it all depends on head shape etc.
-
Did you check the requirements for using VD in terms of using a dedicated router etc?
-
.thumb.jpeg.e9a5eea36533302653032ca510164dc5.jpeg)
Fps loss 50% near water/sea and drawing of fences
Qcumber replied to maks's topic in Bugs and Problems
It's not just there. I have seen it over/around inland water as well. -
F-4E Jester menu messed up in VR(Quest 3) on RX9070XT
Qcumber replied to Buzzer1977's topic in VR Bugs
Not sure if this helps but what is the resolution of your VR mirror screen? Have you tried using Meta cable link? This is probably the best option over Steam. -
Sorry to hear that. The 9070xt looks like a good GPU. Maybe it just needs a slightly different approach to settings compared to Nvidia!? I'm happy to help problem solved if I can.
-
Which GPU For High Settings 1080p
Qcumber replied to tmansteve's topic in PC Hardware and Related Software
4080 to 5080 maybe not. But 4070 to 5080 was more than double performance for less than double the price. -
Yes. A single place with links to useful threads at the top. Updated regularly.
-
Yes. My main aim is to tease out the settings which impact most, irrespective of rig. It's not an easy task. Ideally it would involve using preset values and test tracks that people could run on their rigs and compare results.
-
That's a good point regarding CPU and GPU usage but I'm not sure how I can capture this alongside the other data. Any suggestions about software I could use? It would need to allow data export to a CSV file. It would be interesting to correlate usage with render times. My observation is that if GPU is maxed out then the render time exceeds 13.88ms and fps drops; which is exactly what you would expect. CPU usage would've harder to correlate due to multiple votes.
-
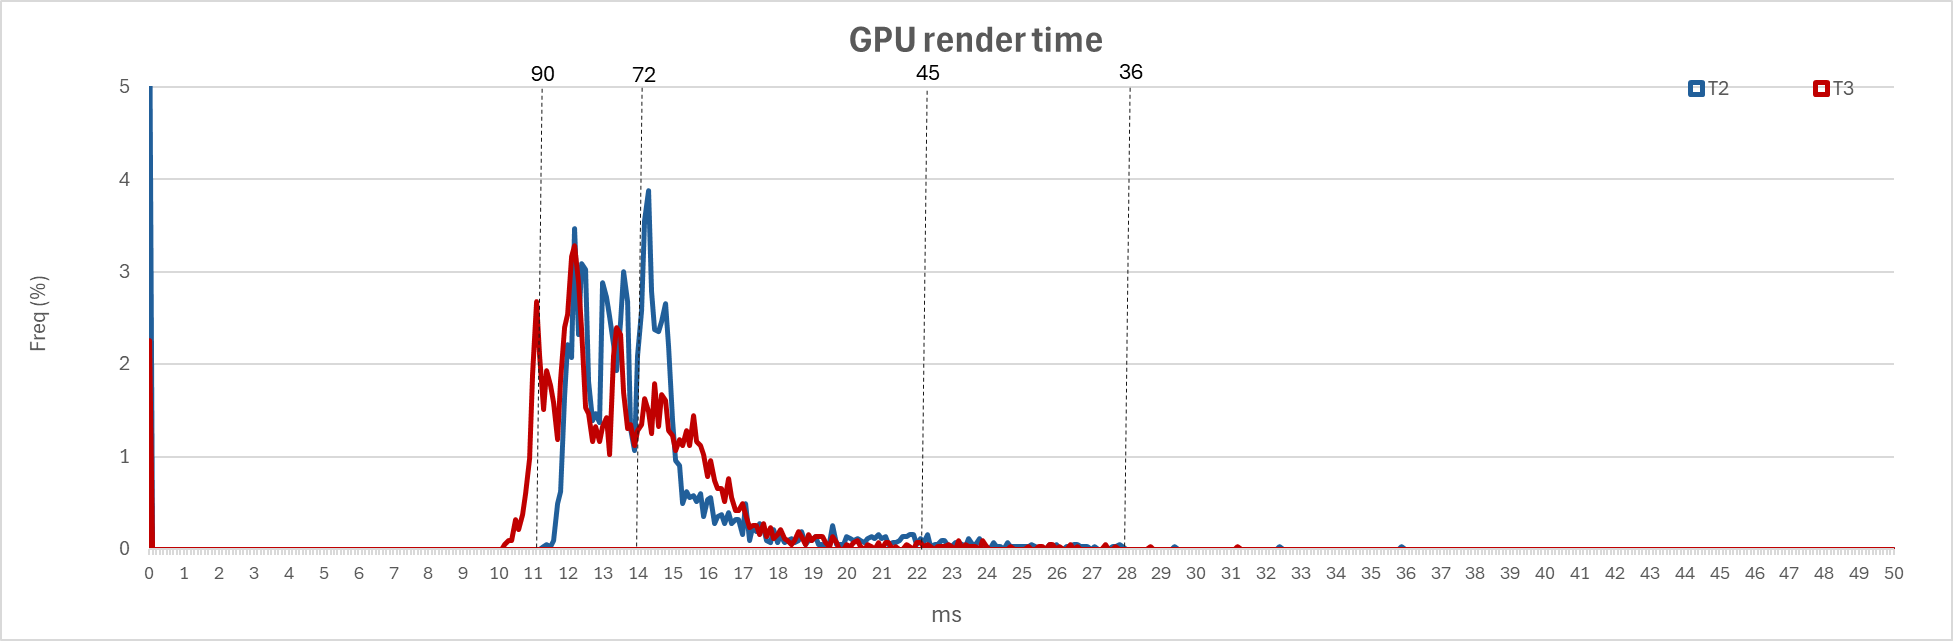
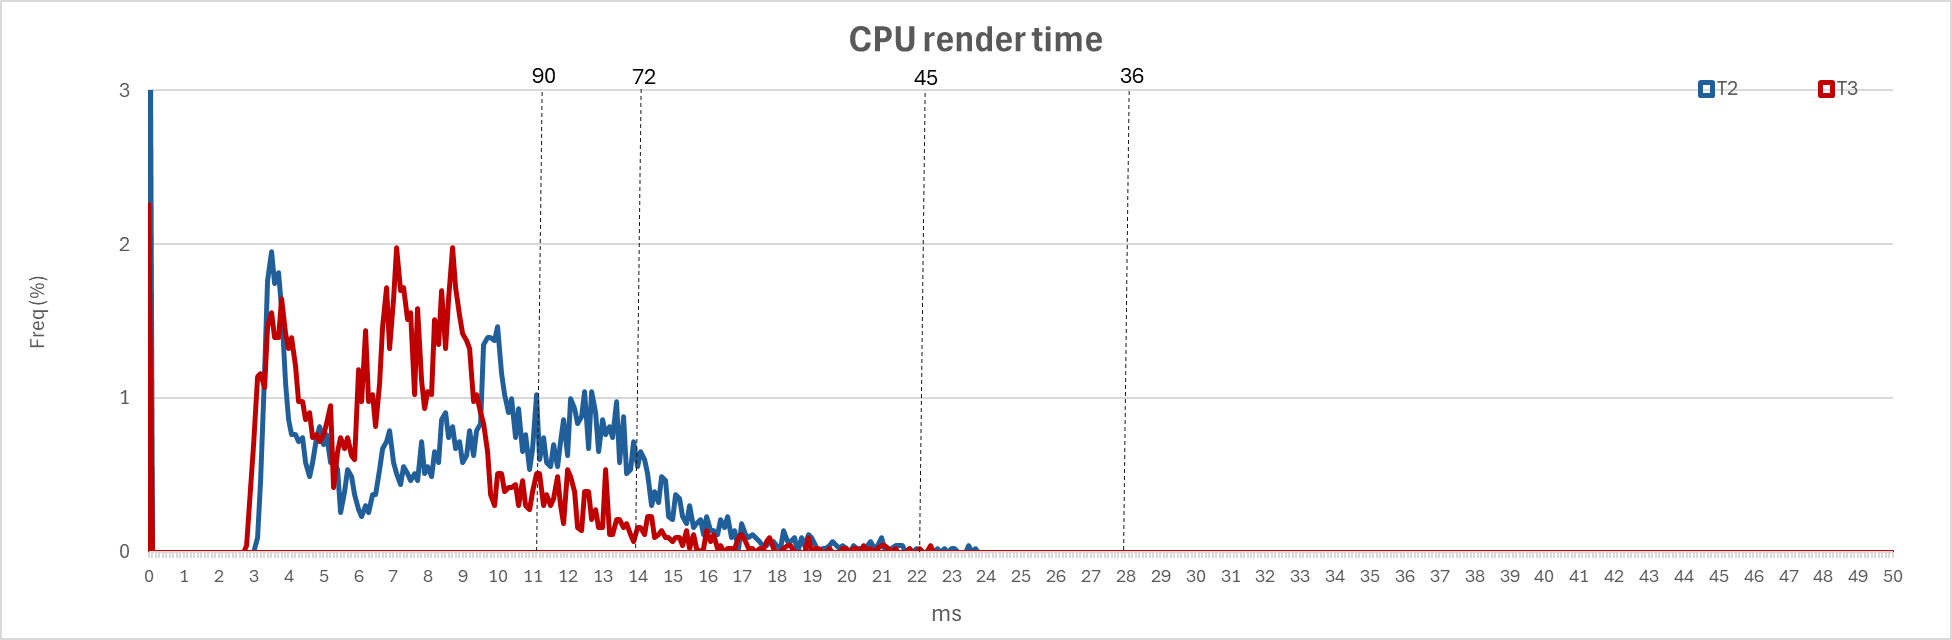
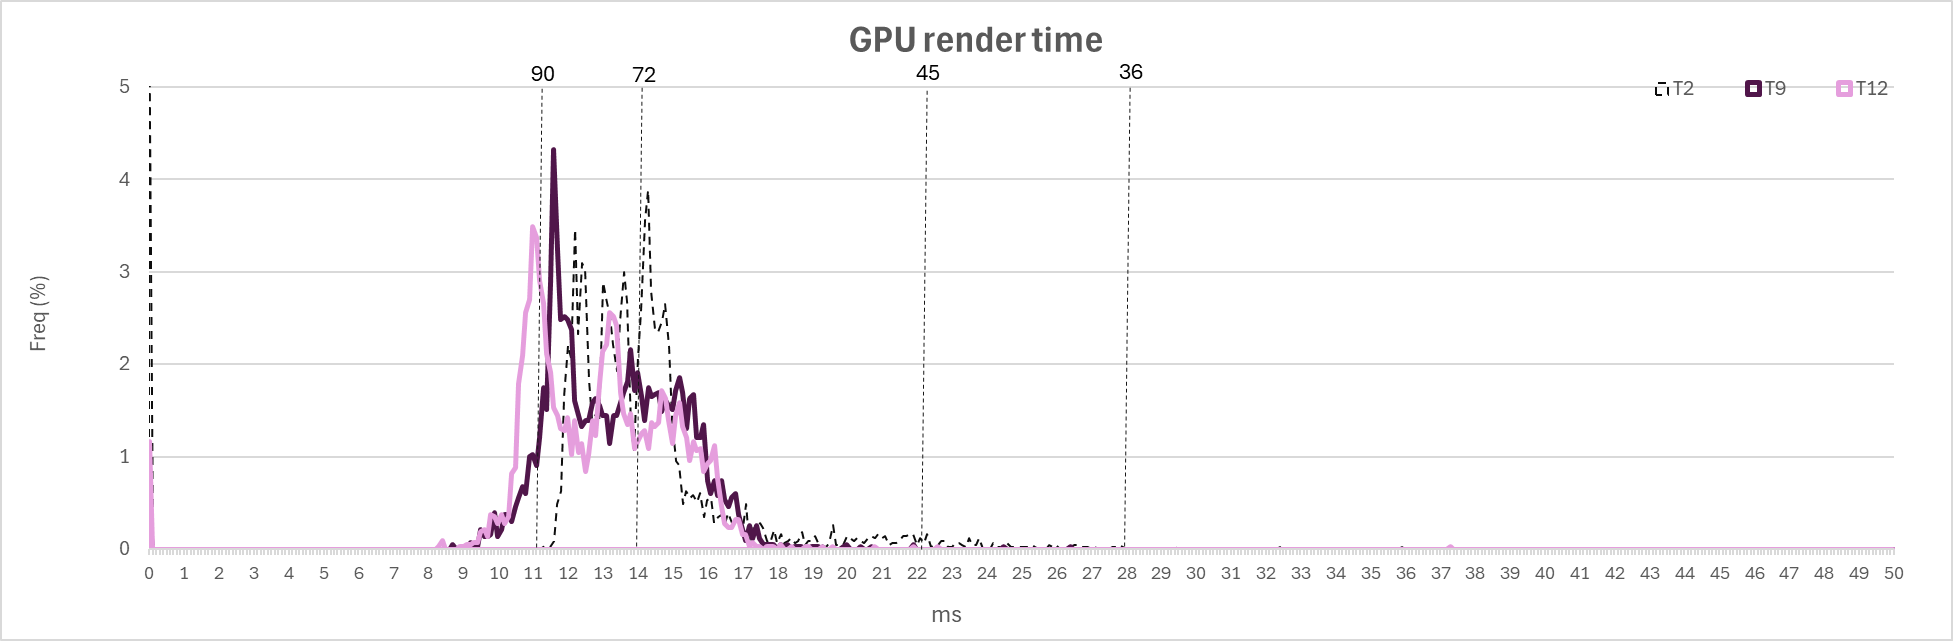
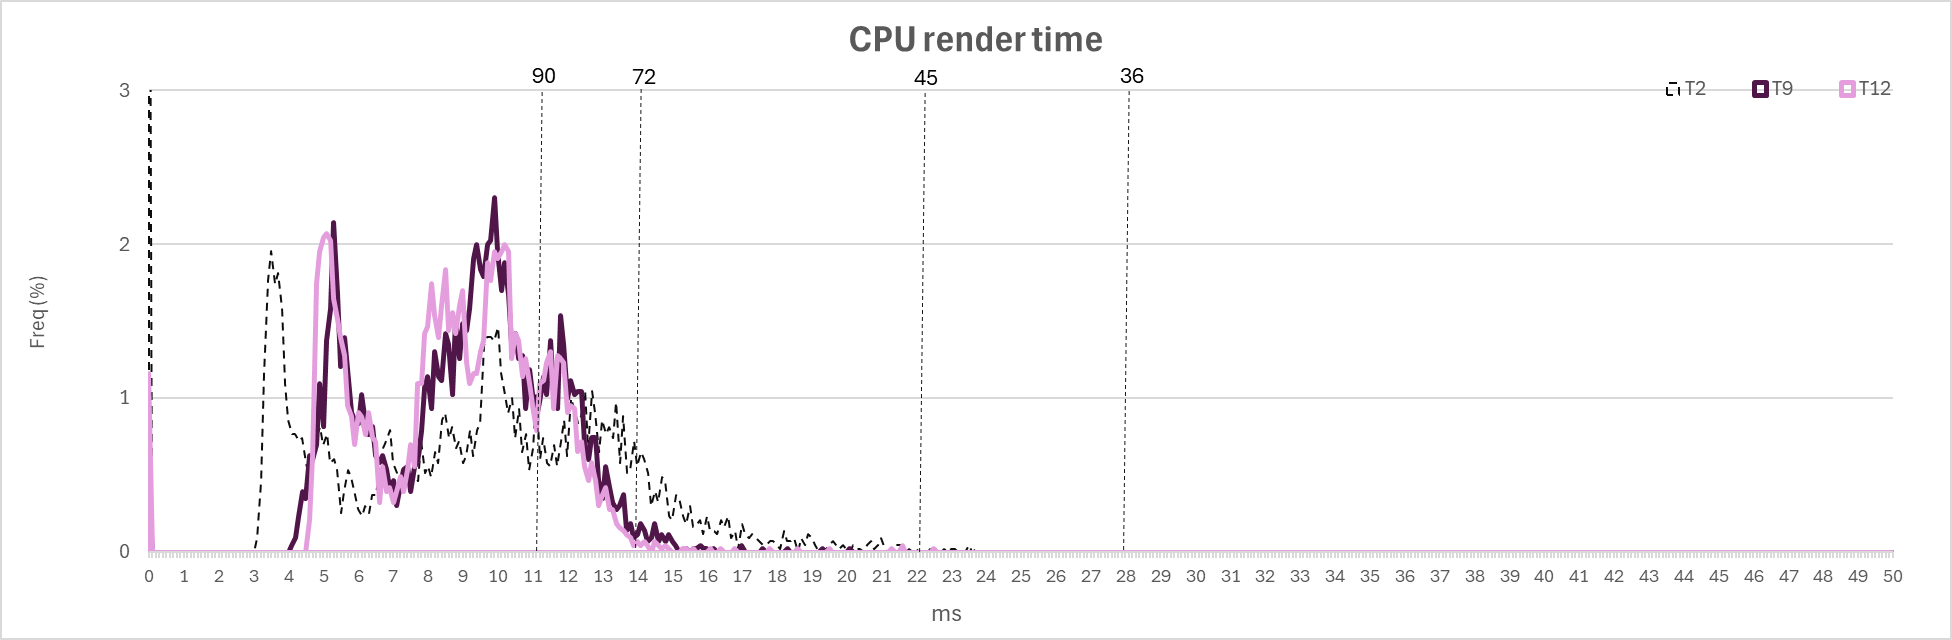
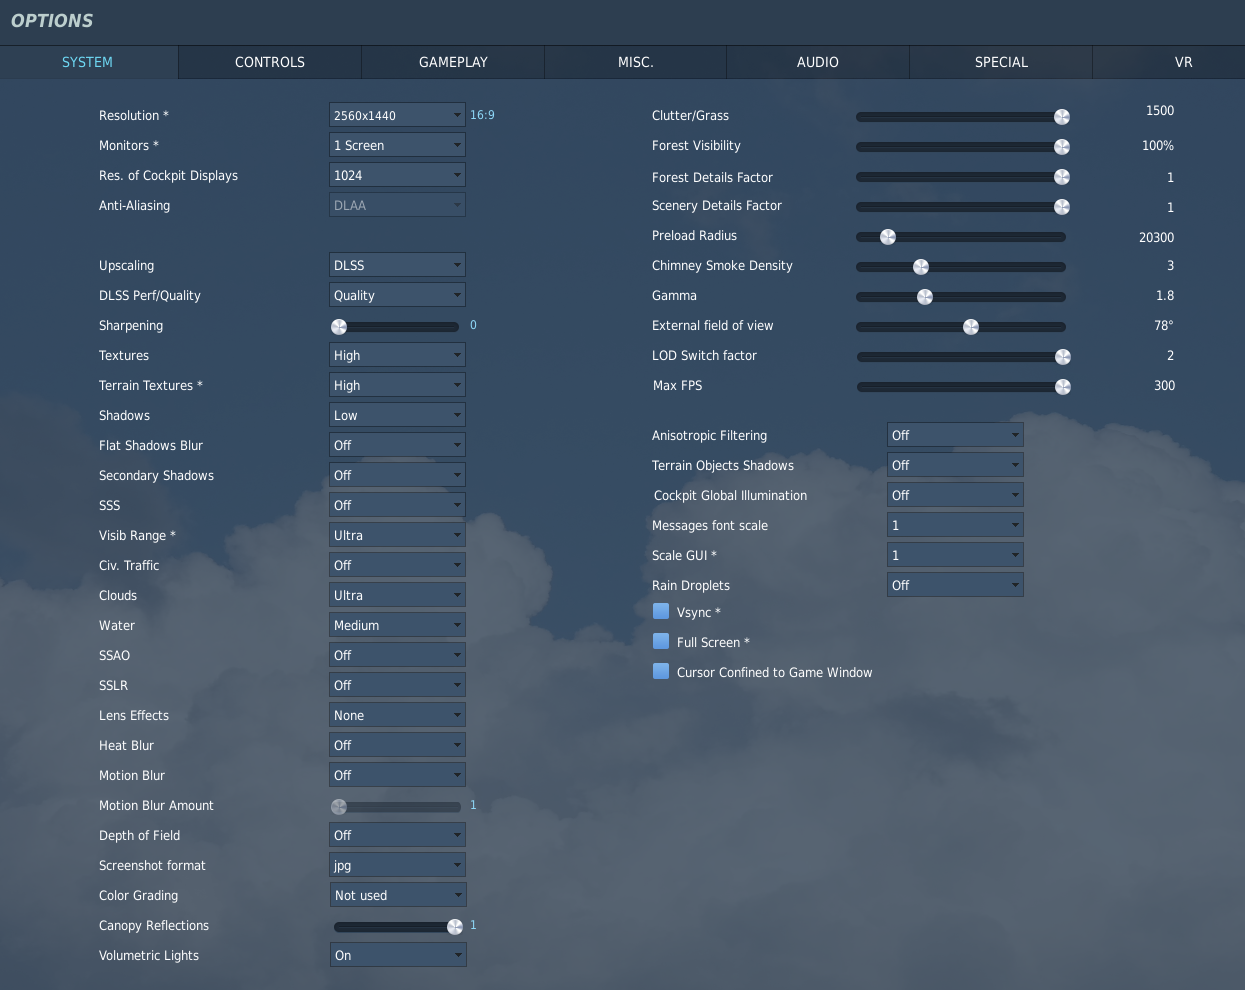
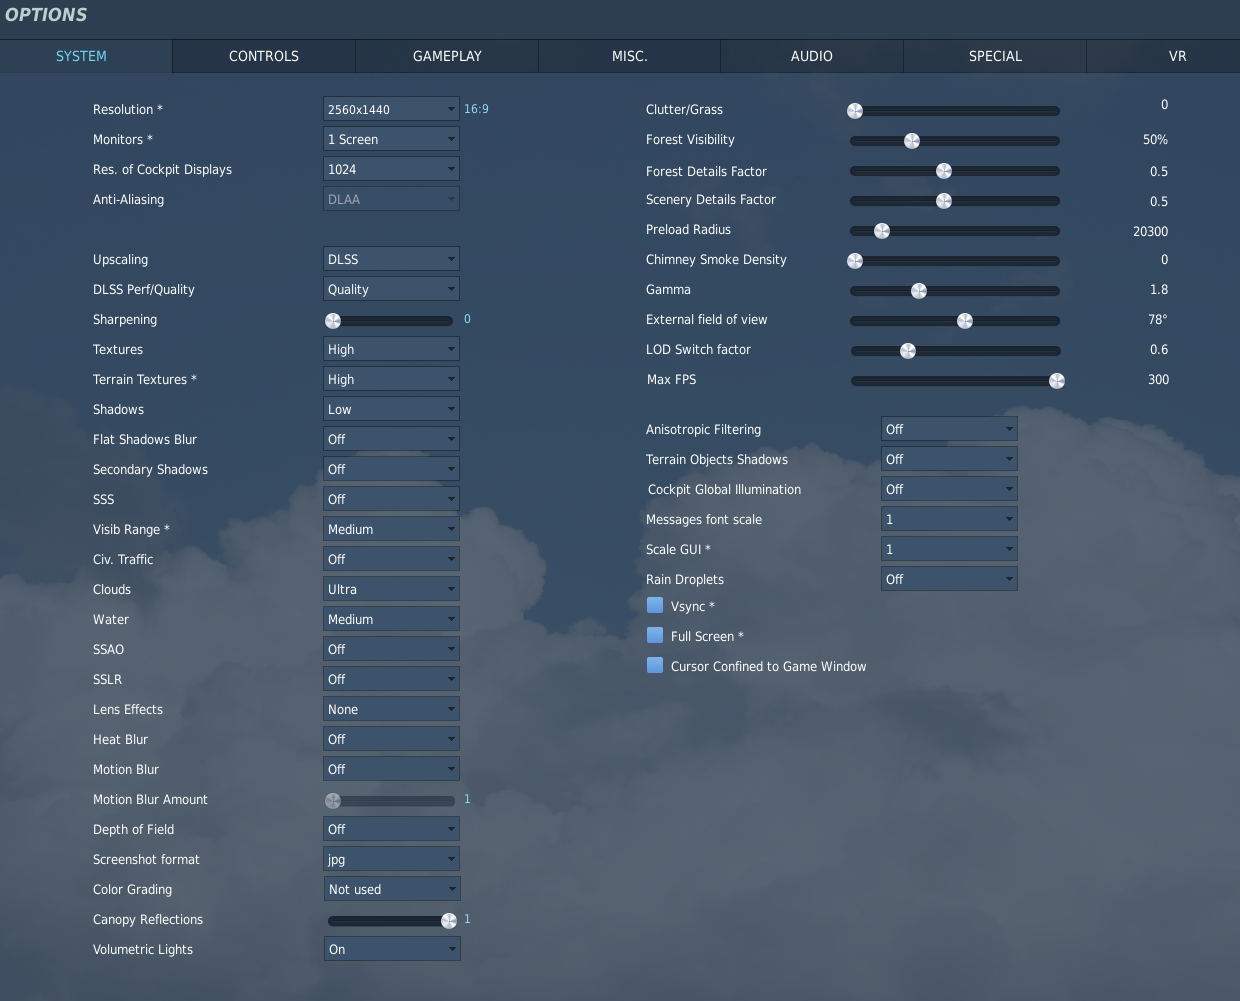
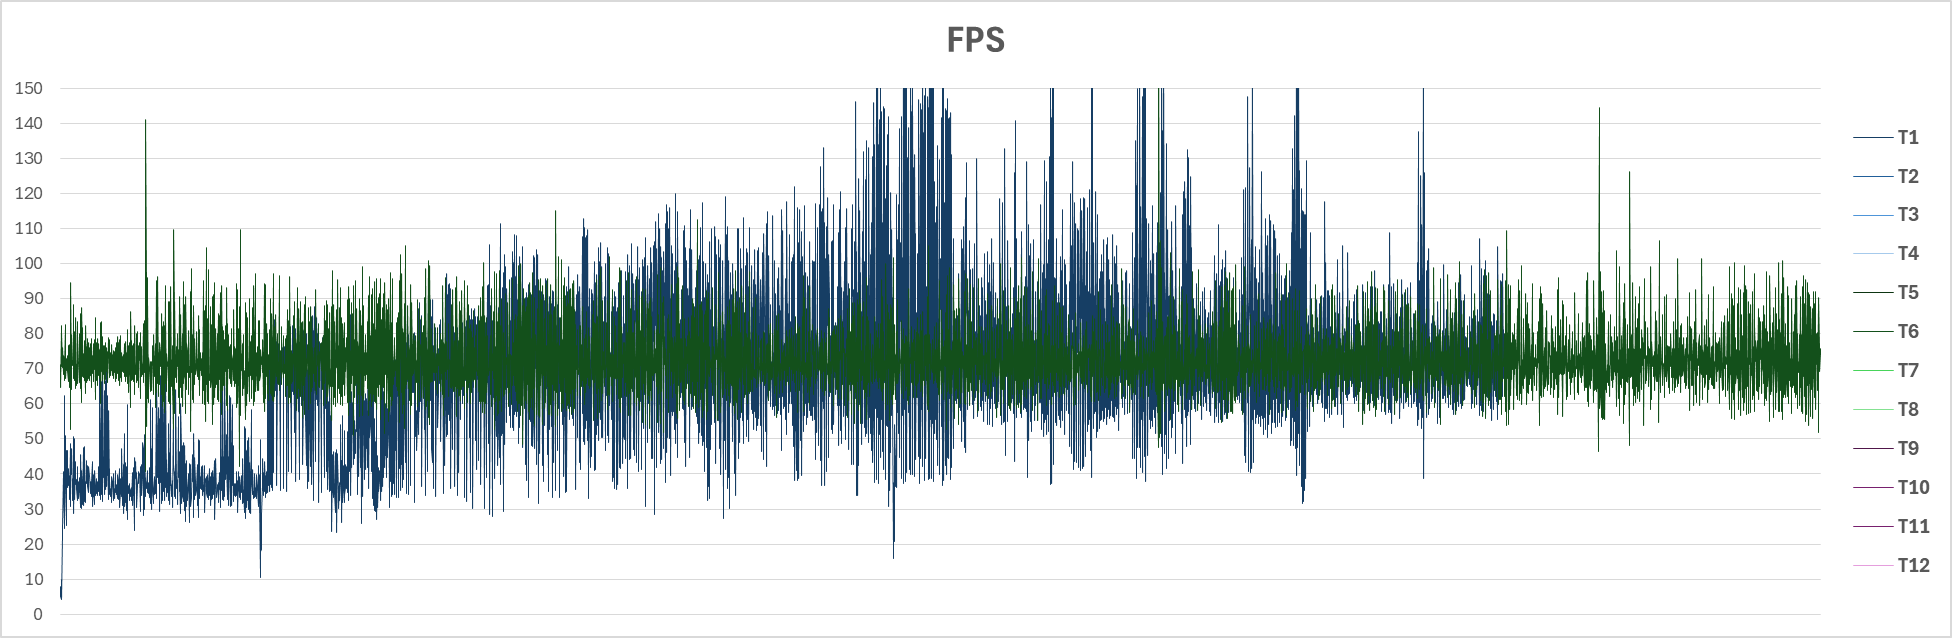
On the suggestion of a Discord member (Orion_42) I have tried this test again without using QVFR and by changing some of the settings. The charts below are 3245x3302 pixels set using OTT. The blue trace (T2) is with visibility range set to Ultra and all the scenery slider set to max. The red trace (T3) with visibility range set to Ultra and all the scenery slider set to lower settings as per the screenshots below. There is only a marginal difference and there is much less stutter and random frametimes than I saw in the previous post using QVFR. To be sure, I retested QVFR using the same settings as above. smoothen_focus_view_edges=0.1 sharpen_focus_view=0.9 horizontal_focus_section=0.4 vertical_focus_section=0.4 peripheral_multiplier=0.5 focus_multiplier=1.1 The dark purple line is with max visibility settings. The pale purple line is minimum visibility settings. The black dotted line is the "blue" curve from above for reference. Overall these results are much better than yesterday and more stable. Interestingly QVFR with these settings has very little benefit in terms of GPU render time (all three situations were around 13 ms. CPU render times were 8-9 ms. Some stutter but still comfortable.

-
Thinking of makeing the switch from Track IR to VR
Qcumber replied to kmaultsby's topic in Virtual Reality
With DLSS 4 you need to push the resolution high to minimize ghosting. If you use QVFR in VR you can maximize the foveated region to optimize performance. Make sure you use preset K. I had a 4070 until recently and you can get a decent performance with this GPU. -
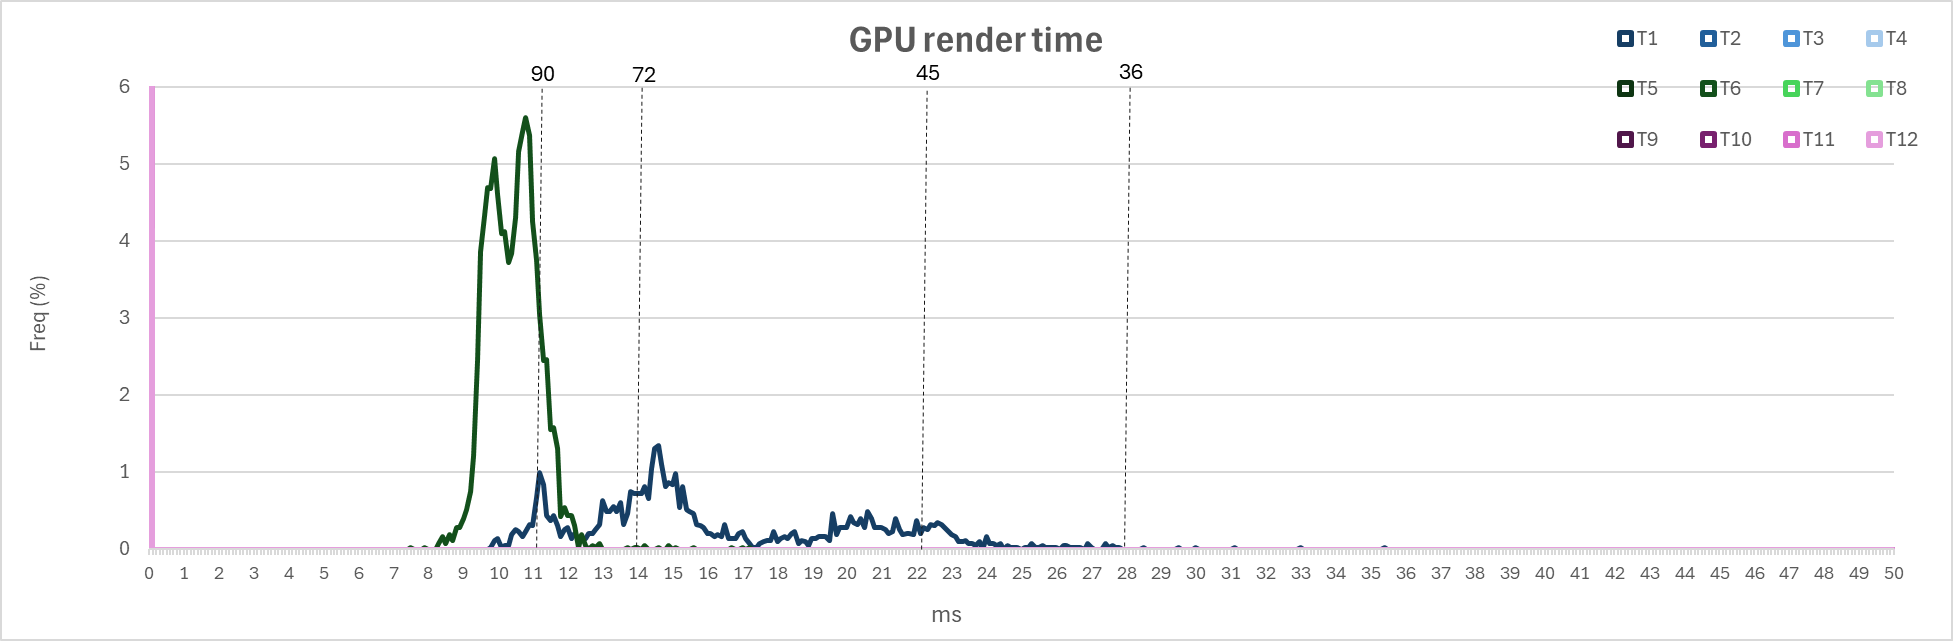
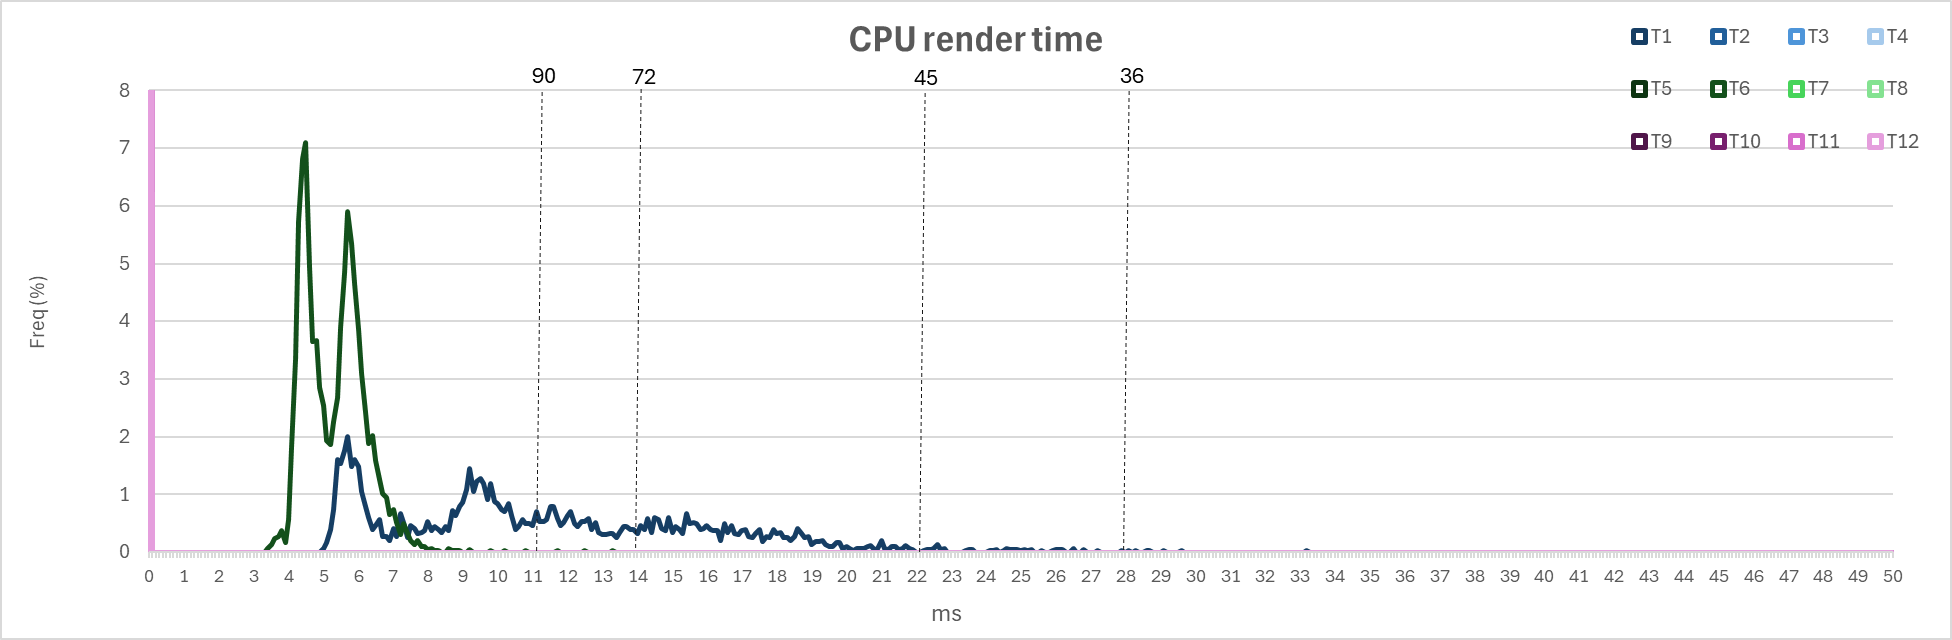
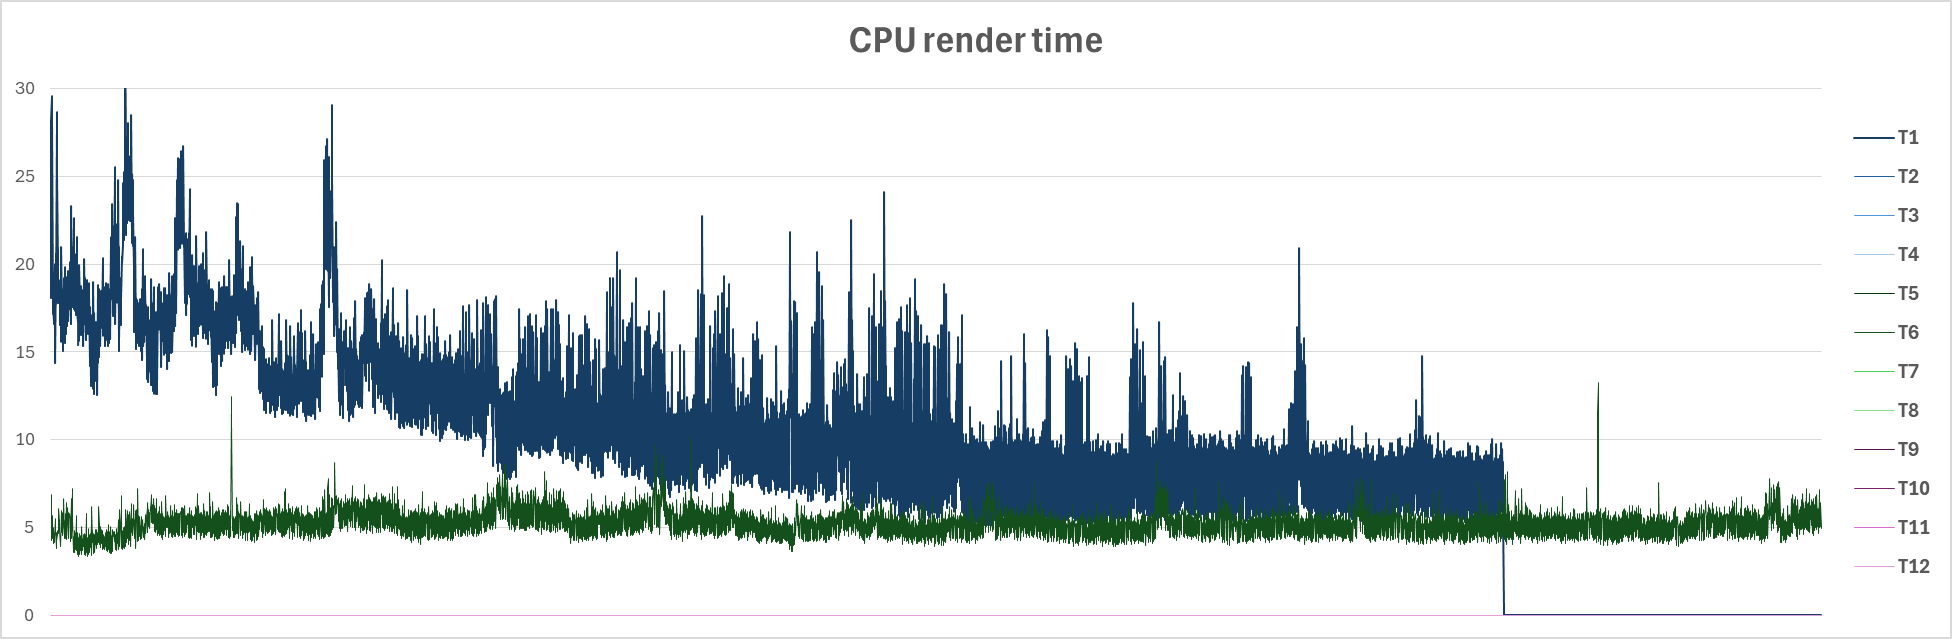
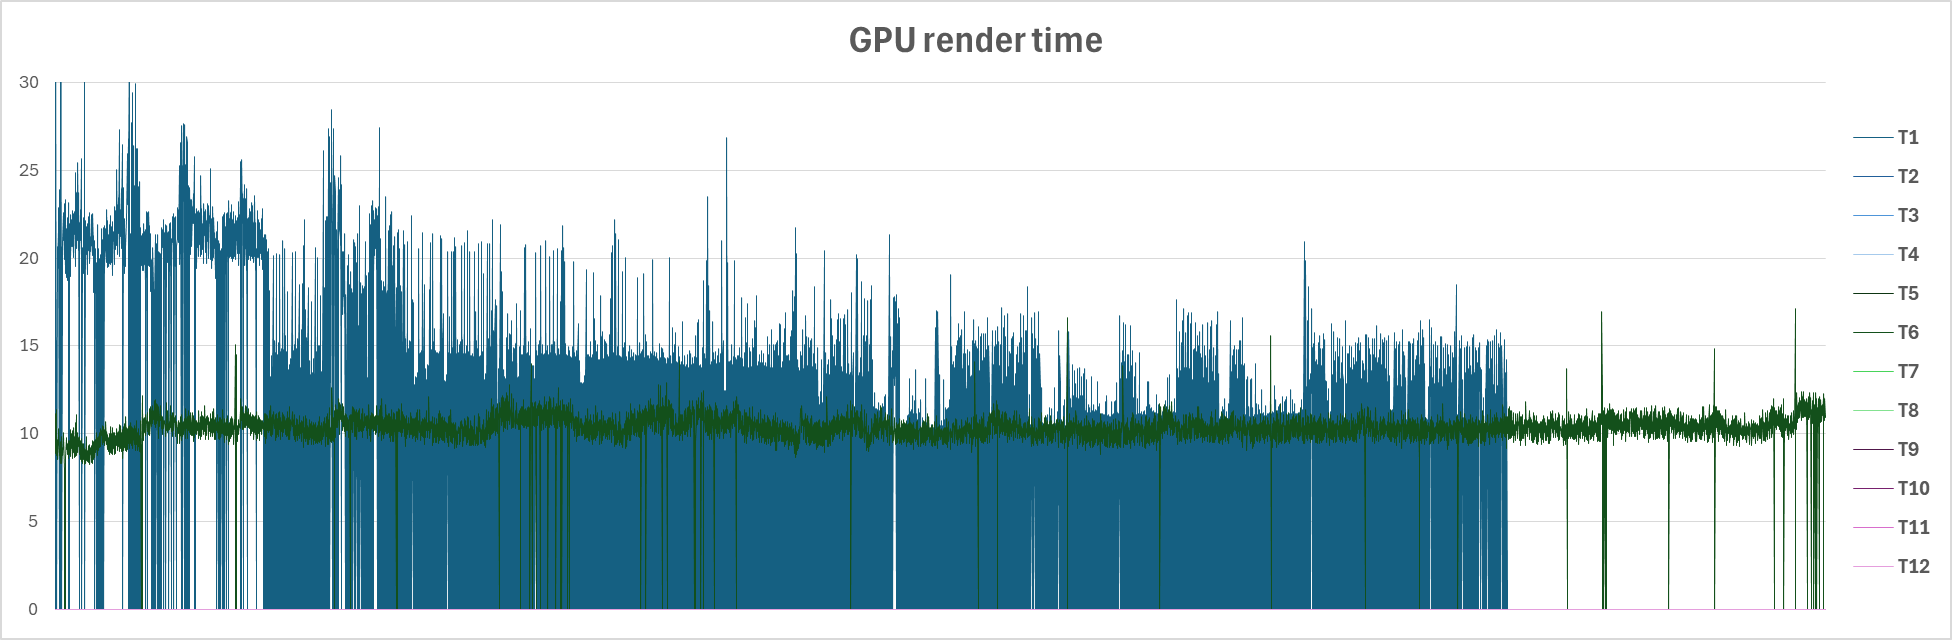
OK. The F-4 take off is painful. Its worse than a take off on the Marianas map! What the hell is going on. It does not seem to be very well optimised in terms of objects etc. Green is F-4 free flight. Blue is F-4 take off (Afghanistan map instant actions). Not all of the GPU render times are being captured so there is something odd here. On the ground both CPU and GPU render times are all over the place. No consistency at all. Once airborne and high enough FPS stabilises. The free flight is a dream performance. Solid FPS and low render times.
-
I'll give it a go.
-
Yes. You can get away with most settings at high. I'll try to post my settings later. I did some relative performance testing a few weeks ago with my 5070ti. These were quite basic so I am hoping to repeat these in a more structured way soon with the 5080.
-
Thinking of makeing the switch from Track IR to VR
Qcumber replied to kmaultsby's topic in Virtual Reality
I use head tracking combined with JoyToKey to reset and offset cursor position, with a wireless "finger mouse" strapped to my joystick. I've been using this setup for ages and it works well. I can reach any switch in the cockpit. I also map a lot of common tasks to the HOTAS and "double up" by mapping one button to be the shift key. -
I'm not sure how much difference it makes but that is what I do. You only really need 1 TB as you OS/boot disk. I 4 M2 PCIE slots on my motherboard so use a 500Gb for OS, a 2TB for DCS and a 1TB for other games etc. Given how big DCS is getting, and how many maps you intend to buy, 4TB is more future proof but is expensive. I have room for another 2-3 maps before I need to upgrade.
-
Eye tracking can be used for Dynamic Foveated Rendering using software called Quad Views Foveated Rendering. This allows high resolution in the centre region and lower resolution in the periphery. It can give you a big improvement in performance. Some people prefer not to use it as you can sometimes notice the low Res in your peripheral vision but this can be tweaked with settings. Yes but I don't find it very useful. Others have though.
-
Is this the PTC version? I have been avoiding using PTC but might give it a go if it's working OK with the QP.
-
+1 for Quest Pro.
-
+1 for the Quest Pro. It remains a very overlooked headset but is one of the best. Particularly with regards eye tracking. It makes a massive difference in terms of performance. Forget pixel counting and comparing paper specs. Real world performance with this headset is excellent. I managed to get mine used for £300. As new condition. You might get lucky on eBay.
-
I ended up getting a 5080 and sending the 5070ti back. It's a good card but I managed to get a 5080 FE for oy £150 more than the 5070ti. The 5070ti works very well in VR. I use a Quest Pro with eye tracking. It can manage 72 fps in most situations.
-
Fps loss 50% near water/sea and drawing of fences
Qcumber replied to maks's topic in Bugs and Problems
I have also seen big dips in performance when flying towards large bodies of water inland. e.g. flying NW from Berlin towards Warren there is a large group of lakes (sorry but I am not sure what they are called). Very strange. It's the only performance issue I have seen so far on this map. -
What do the CPU render times look like when this happens? With a 9800x3d they should be around 6-8 ms (my experience with the F4). Are the GPU render times OK? At 60 fps locked they should be below 16.6 ms.
-
Which GPU For High Settings 1080p
Qcumber replied to tmansteve's topic in PC Hardware and Related Software
What about a 4070? 12Gb RAM and pretty good performance in VR. I used to have one before upgrading.