
Kefa
-
Posts
19 -
Joined
-
Last visited
-
Just an fyi, take a look at that ubiquitous "GAO" document. On pg 83 there is a navair chart w/F-18C specific excess power at 10kft, 1g level, .9 mach number, and at 33,325lbs configuration weight. It is 699fps. The haf Block 50 at 10Kft, 26,000lbs, 1g, level, and .9 mach has well over 800fps probably closer to 900fps of excess power. Giving it a near +200fps energy addition advantage against the 402 Hornet at that velocity. So at .9 mach the Hornet is not going to out sustain turn the F-16. And that GAO document also gives SL turn rate of 19.2 and at 15Kft of 12.3. Doing a little math at 10,000ft max turn rate should be about 14.6dps. Though this 14.6pds most certainly isn't occurring at or near mach .9. Guessing it peaks out at around somewhere in between mach .7-.8. and then downwards to mach.9. So the Hornet turns well at slower speeds. In addition, the 402 F-18 was somewhat of a rare commodity. It seems most went to the Marine Corps. And that jet clean or with just 4aams and no pylons is going to be a great performer. Though at altitude and start adding pylons and the Hornet noticeably loses steam. I also believe that the paddle will only help with instantaneous performance (asked a USMC Hornet baby and he concurred ((though he did mention never actually needing to pull it)), and will be little or of no factor for sustained turning since, and as the GAO document proves, P's are on a decline past peak sustained turn rate to mach .9. So the paddle is not some thrust turbo button for sustained turning regardless of increasing G limits. In addition, when speaking of F-16's performance in BFM. By far the most numerous variant was the Block 15 or 30BI. Not so much the Block 50, which is also the heaviest the USAF ever flew. The Viper's stellar BFM characteristics were solidified over the years with the Block 10/15 and for the C variants most certainly the Block 30. Even with the GE 129 motor, all that weight still degrades turning performance to a point and makes its wing work harder.
-
Where is the documentation that specifically states that opening g limits past 7.5g, i.e. using the 'paddle' will increase maximum sustained turn rate? I am willing to bet that the real life Hornet natops em diagrams that nobody seems to have, including ED, only tested the jet up to 7.5g. For example, the F-14A natops has em diagrams at about 6.5g and also out to 7.5g., and all that shows is that P's (including Ps=0 line) are still on the decrease regardless of the expanded g limits. It is just my opinion, but I do not think that the paddle equates to a 'turbo' button on the jet at least for sustained turn rates. If anything the paddle will give you expanded instantaneous turn rate. Meaning that typical Hornet corner velocity of 7.5g at 310knots will now allow the pilot to pull to 9g with a bit more speed; all while at the cost of higher energy bleed rates.
-
Yes, I know the F-16 is not fully at 9G throughout the turn in the Hud. And I don't think I ever alluded to the point that it was. What I did mention is that General Dynamics F-16 program pilot Neil Anderson, a guy that had many hundreds of hours in the jet, said that pilots who fly the plane "could possibly" be experiencing and as he said "9G from 14-17 seconds. " In many of those airshow demo videos, the F-16 is not sustaining 9G. What the jet is doing is pulling 9G at around 400knots and basically riding its limiter down to about 5.5g. Hence it is a very quick decelerated turn; and giving a tighter turn radius than a full 9G sustained turn. Maybe the grey area in the fm is the area above the sustained turn rate line to max instantaneous turn rate or where it hits maximum instantaneous turn rate and back down the limiter. Meaning the negative Ps lines between the two. There are ways to convert it from feet per second to degrees completed vs time. But the question is how well is it reflected in simulators as to the real thing.
-
I don't know if this was posted before. But the narrator for this I believe is General Dynamics F-16 test/program pilot Neil Anderson. While the jet is not a Block 50, Anderson none the less talks about 9G's and the duration the pilot could possibly be experiencing them in a turn.
-
PSA: F-14 Performance/FM Development Status + Guided Discussion
Kefa replied to IronMike's topic in DCS: F-14A & B
Steamer discussed flap behaviour at least in the real world. -
investigating Thrust to weight ratio: confused
Kefa replied to bkthunder's topic in MiG-29 for DCS World
Perhaps the Mig-29 and Su-27 Clmax figure is at where their limiter kicks in which I think is about 26degrees or slightly more. For example, F-16 has a Clmax of a little over 1.6 at 25AOA and 1g. And that is at the limiter, so you give up a few degrees to save airspeed, so to say. Limiters aside, according to Fred Clifton, Mig-29 and F-16 maximum lift occur around 35degrees. From Ray Whitford's book, lift loss due to trimming (for a stable aircraft) amounts to 10-15% of max lift.
-
investigating Thrust to weight ratio: confused
Kefa replied to bkthunder's topic in MiG-29 for DCS World
I understand the F-14 Clmax is over 2. Point being we have its +/-specific excess power plots also. If you look at the F-14B (I haven't figured it for the A yet) at 5,000ft turn chart w/4 sparrow/4 sidewinder 55,620lbs. Attempting to "ride" its max lift curve level (in actuality we would be a few degrees slightly in front of it -or we depart the jet); From .5mach approx 303KCAS and 6.5G the estimated negative specific excess power is (my own estimate, since chart stops at -800) around -1200fps. If we "ride" the top of that max lift line all the way down to .2mach approx 120KCAS and 1.8G, the negative specific excess power is now at -100fps. In measuring from -1200fps/303KCAS/6.5G to -100fps/120KCAS/1.8G the F-14B can only complete 127 degrees of turn before basically stalling out or having to terminate its turn. Even if you extrapolate the curve to 7.5G and estimated -1500fps at .54mach the F-14B now only completes 142degrees of turn before basically stalling out and having to end turn. This certainly does not equate to having optimum turn performance. And I don't even know if the jet can actually fly that slow (down to 120KCAS in a turn), perhaps I should have stopped at just 150KCAS, but I decided to compute it even further down the max lift line. I would also expect the A to have completed less of a turn, while at a slightly smaller radius than the B. The point being is that jets with limiters while in essence never reach Clmax, they however will complete more degrees of turn at the cost of a slightly larger turn radius. Perfect example is Dassault Rafale, and early F-16A. Now problem here is the only charts that include all the negative specific excess power lines is the Hellenic F-16 manual. Both Tomcat manuals stop at -800fps, yet the A has a few chart that actually go beyond -800fps I think. The F-15 does not include them, and to my knowledge nor do the Flanker or Fulcrum. While the F-14A 1977 SAC has one chart, a VN diagram for 35,000ft. That measures peak specific excess power loss to -36kps at 1mach and 5.5G. If we convert that to fps it is about -1837 if I am not mistaken. Edit: stopping the turn to -200fps/at max lift or to basically .26mach, now the jet only completes 85 degrees of turn that is if you start turn at 6.5G and 303KCAS. If you start turn at 7.5G and .54mach Tomcat completes almost 100 degrees of turn, again, ending at .26mach. -
investigating Thrust to weight ratio: confused
Kefa replied to bkthunder's topic in MiG-29 for DCS World
@Top JockeyIt NAVAIR F-14AAA-1.1 Mig-29 I used this one Don't have Fulcrum or Flanker specific excess power lines though. While sustained rate turns matter too, so do turns above the PS-0 line. I mean, turning while at the expense of airspeed. And that is important.
-
investigating Thrust to weight ratio: confused
Kefa replied to bkthunder's topic in MiG-29 for DCS World
@Top Jockey Look in the manual at Specific Excess Power diagrams. F-14A at 5G down to sea level translates to about 17.2degree per second, at 6.5G it is 16.8. So top of PS-0 slope is probably about 17.6dps. Lose the 8aams/ gun ammo/ all pylons and you are probably at about 19dps. -
investigating Thrust to weight ratio: confused
Kefa replied to bkthunder's topic in MiG-29 for DCS World
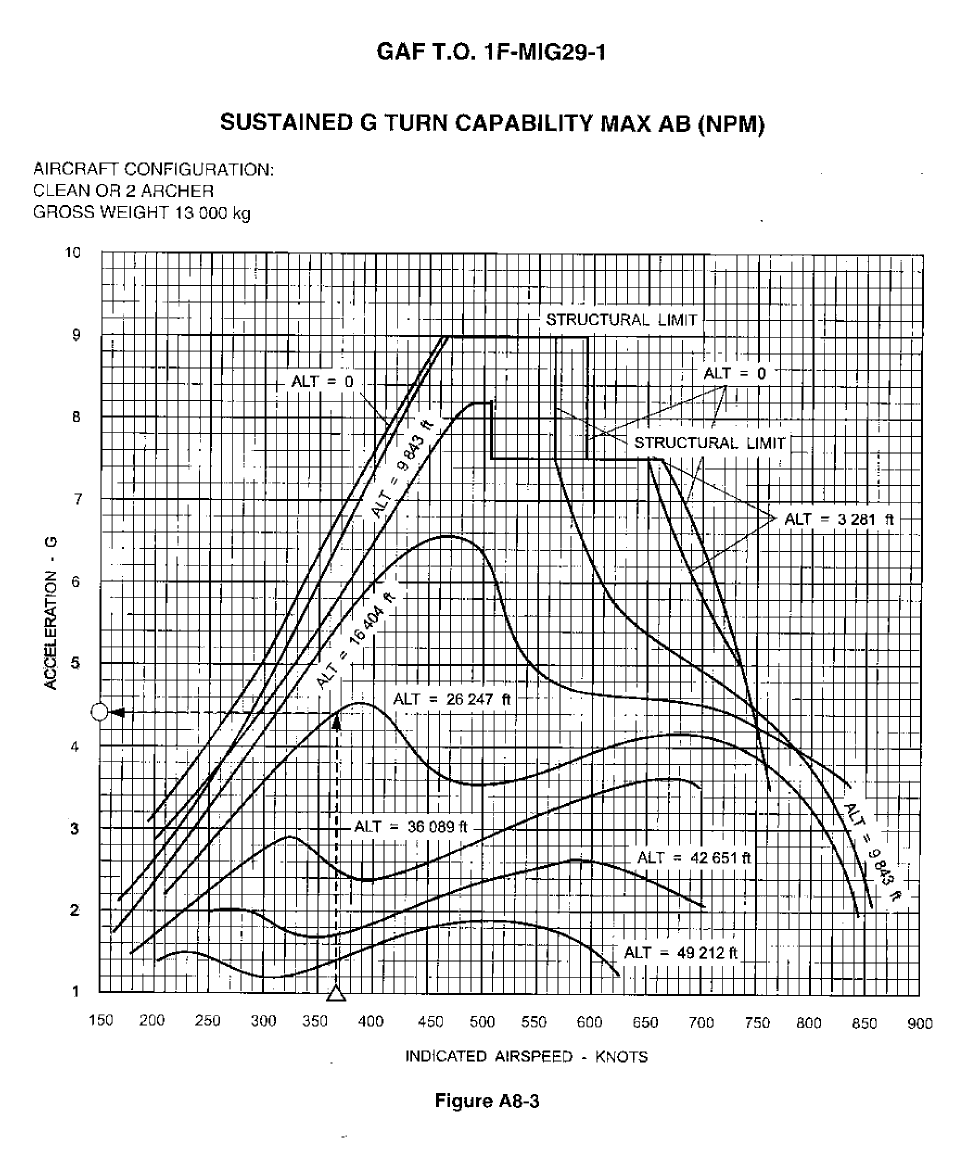
From the German air force Mig-29 diagram, it can sustain 9G at 460kias. You then convert from radians to degrees, then Mig-29 at 13,000kg can sustain a 21.2degree per second turn at sea level. You can do the same with F-14A specific excess power diagrams to sea level. And then basically add about 1.4 degree per second to the total because you subtracted the 8 air to air missiles and pylons. Anyways, the Fulcrum has a very good instantaneous turn. And it also has a better maximum performance turn than even the Mirage 2000 according to this Indian Air Force pilot. https://www.scribd.com/doc/21520658/Mirage-2000-Vs-MiG-29-Rivals-from-the-same-team Even though Mig-29 has less fuel, in certain cases shouldn't it need less afterburn usage in dogfights? While its other less powerful opponents like F-14,F-15, F-18, and most type of F-16 would need greater afterburn use to compensate. -just my thoughts here. -
PSA: F-14 Performance/FM Development Status + Guided Discussion
Kefa replied to IronMike's topic in DCS: F-14A & B
In the manual there are Specific Excess Power Diagrams for 1,3,5,6.5g. I followed Ps=0 line down to sea level, looks like with 4x4,50%fuel, 55,620pounds F-14B tomcat sustains 6.5g at around .62mach and then again at .95mach. For 5G looks like it is at about .47mach and 1mach. -
I understand that you did that for SL. If you do the math for 15,000ft, It actually looks like the Block 50 viper out rates the 402 hornet. So I used the 19,261lbs empty weight figure shown on Page B1-3 in that listed load out problem example from HAF-1. I came out with a weight total of 25,113lbs. Then I used the GW effect-change Turn Rate chart. I averaged the 10 ,000ft and 20,000ft DI 50 charts out for 15,000. I came out with a maximum sustained turn of basically 12.7dps. I rounded 12.65 up to about 12.7 because the DI is now down to 26 from 50 I think. But maybe too conservative estimate on new DI effect. Isn't the 402 Hornet at 12.3dps in that paper.