Figaro9
-
Posts
127 -
Joined
-
Last visited
Content Type
Profiles
Forums
Events
Everything posted by Figaro9
-
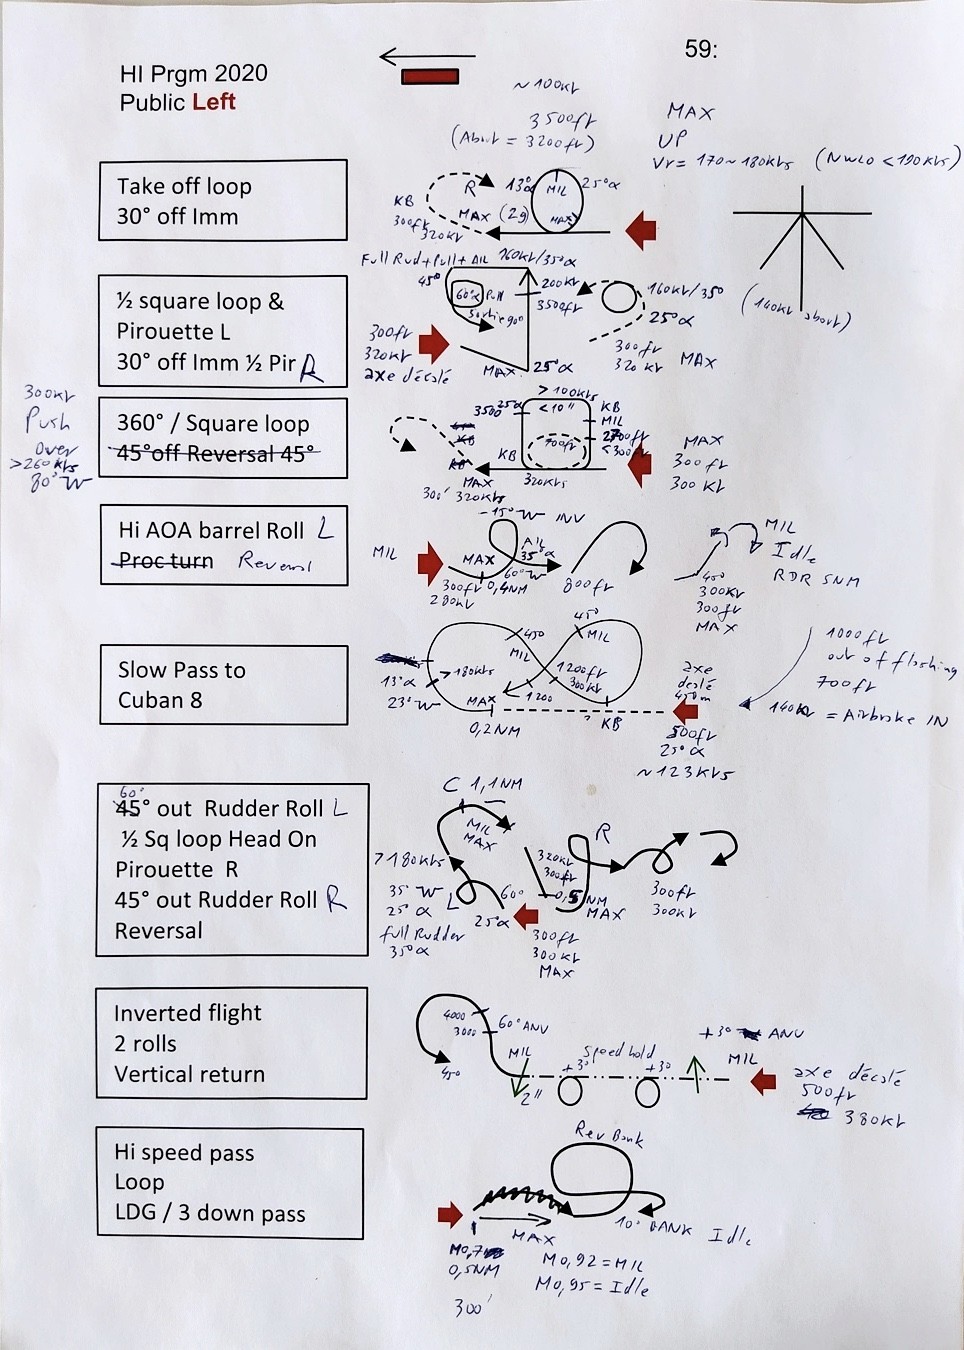
Afaik ed is aware that aoa needs tweaks. Here is a thesis on f-18 spin demo procedures. According to that document the pirouette works best at aoa ~45° and ~ 150kts. We do not get there atm in dcs. There are graphs showing yaw, roll and pitch rates as well as aoa. Aoa goes up to more than 60°. And yaw rates are up to 50° if thrust is split (max/idle). Yaw rate is higher too in dcs if you do so, but if you try max/idle, you enter a unrecoverable flat spin and the arrows show up almost immediately… With mil/idle split set I managed to do a full 360° pirouette in slightly more than 9 seconds, which means an average turn rate of almost 40°/s. Without split-throttles it is approx 3 seconds more. There is some data available to improve aoa capability (and pirouette logic) in dcs. https://trace.tennessee.edu/cgi/viewcontent.cgi?article=3738&context=utk_gradthes
-
Heres a demo program with pilot notes presented by the saf display team showing target altitudes, airspeeds, aoa and throttle settings for different maneuvers. https://de-de.facebook.com/swisshornetdisplayteam/ We sould be able to pull 45° Aoa at 160kts in the lot20 before we apply pirouette input. By pulling to an aoa of 60° the nose would rise ~30° above the horizon (while the flight path goes down 30°). For more impressive pirouettes we need more realistic aoa capabilites.

-
If you do not have data, search the web, or books etc. try to bring yourself to the same level of knowledge as ed . There is plenty of info, not as easy to interpret as em-plots, but tons of nasa data (drag, lift, polars, thrust data, sep, envelopes, etc) for the f18, even maneuver charts. Probably far more than for many other existing modules. Enough to built a high fidelity module for scientists and developers like ed. Not to forget the sme inputs. If a fm does not behave as you expect, your expectations might be wrong. Or ed and independent scientists are. I tend to trust the latter, math based on aerodynamic (nasa) data. Call me naive. ED knows where the fm needs tweaks and there should come a fm update „soon“. I expect slightly higher sep, slightly better aoa-capability and moderate higher speed bleeds at corner based on my tests against public available data. And (marginal to) almost no str or itr changes. But probably my sources and expectations are wrong too . We will see. But this is not the f18 thread right?
-
Yes, I think there were changes, but it seem closer to rw now. Iˋd say the pirouette works in dcs, but we probably still lack of aoa capability although some improvements have been made. The maneuver in airshows is described in the us tac demo manual, only for E model though. Start 800ft above ground, 350 kts Full Ab, pull 5-6g into the vertical. At 5000ft agl full aft stick and hold 35° aoa . You do get 35° in dcs only below ~ 200 kts, I can not do a constant aoa loop over the top so far at 35° aoa. fm needs probably some tweak here? Capture 175 kts at 35° aoa and when 40-50° nose low, apply pirouette input. Pirouette works best (for the e model) at 175kts according above mentioned manual. I can hold approx 150 kts at 35° aoa in the trk Hold 35° aoa Remove Inputs. I have red that in the lot 20 they initiate the pirouette inputs at 40° aoa.... pirouette 10-21.trk
-
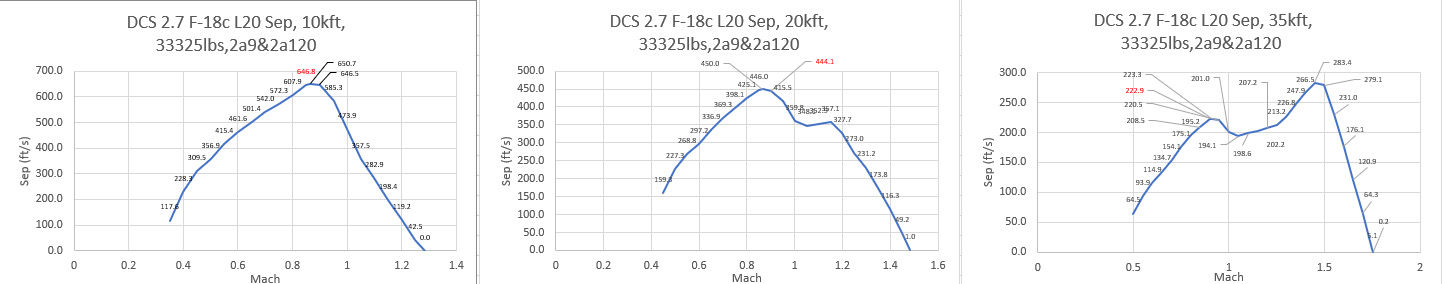
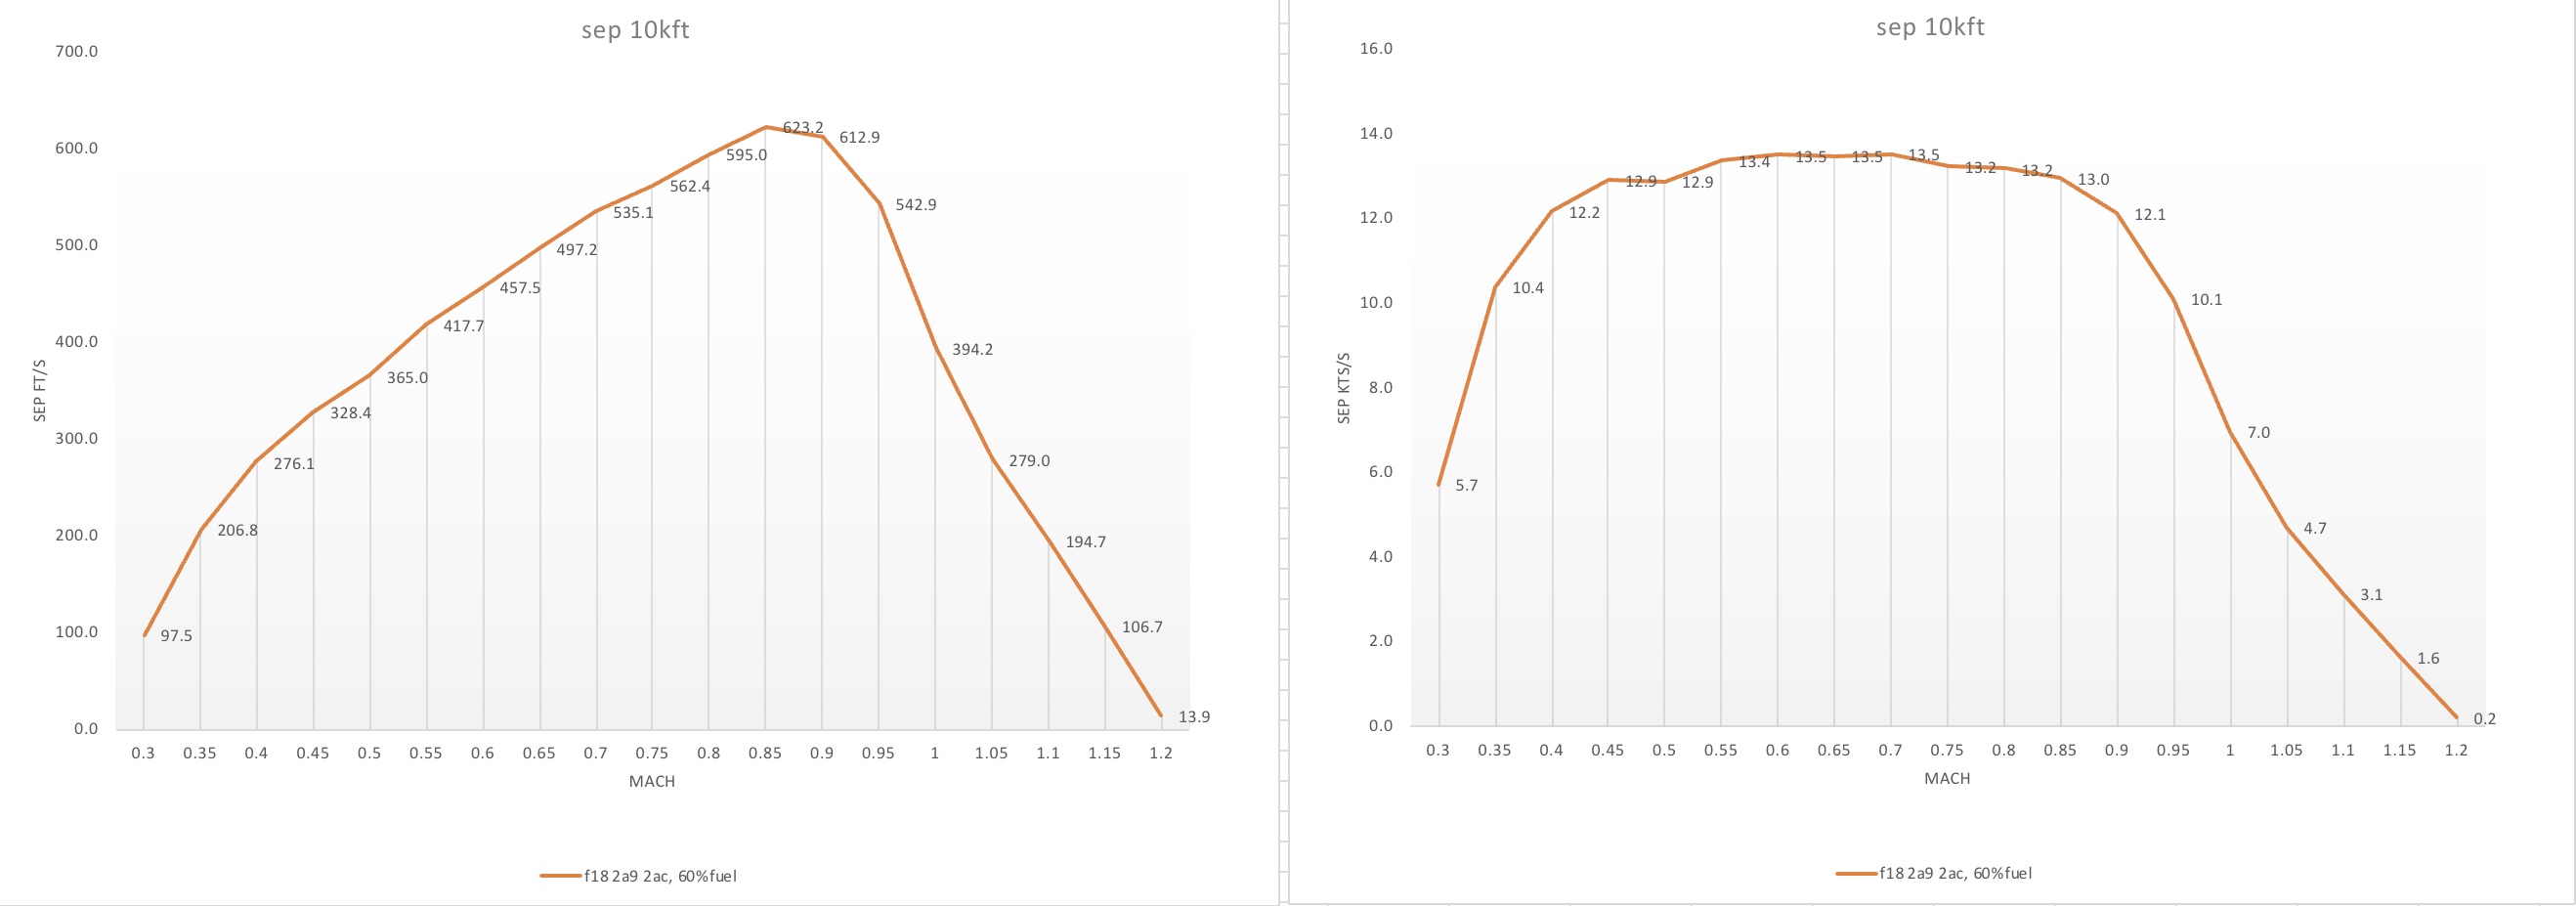
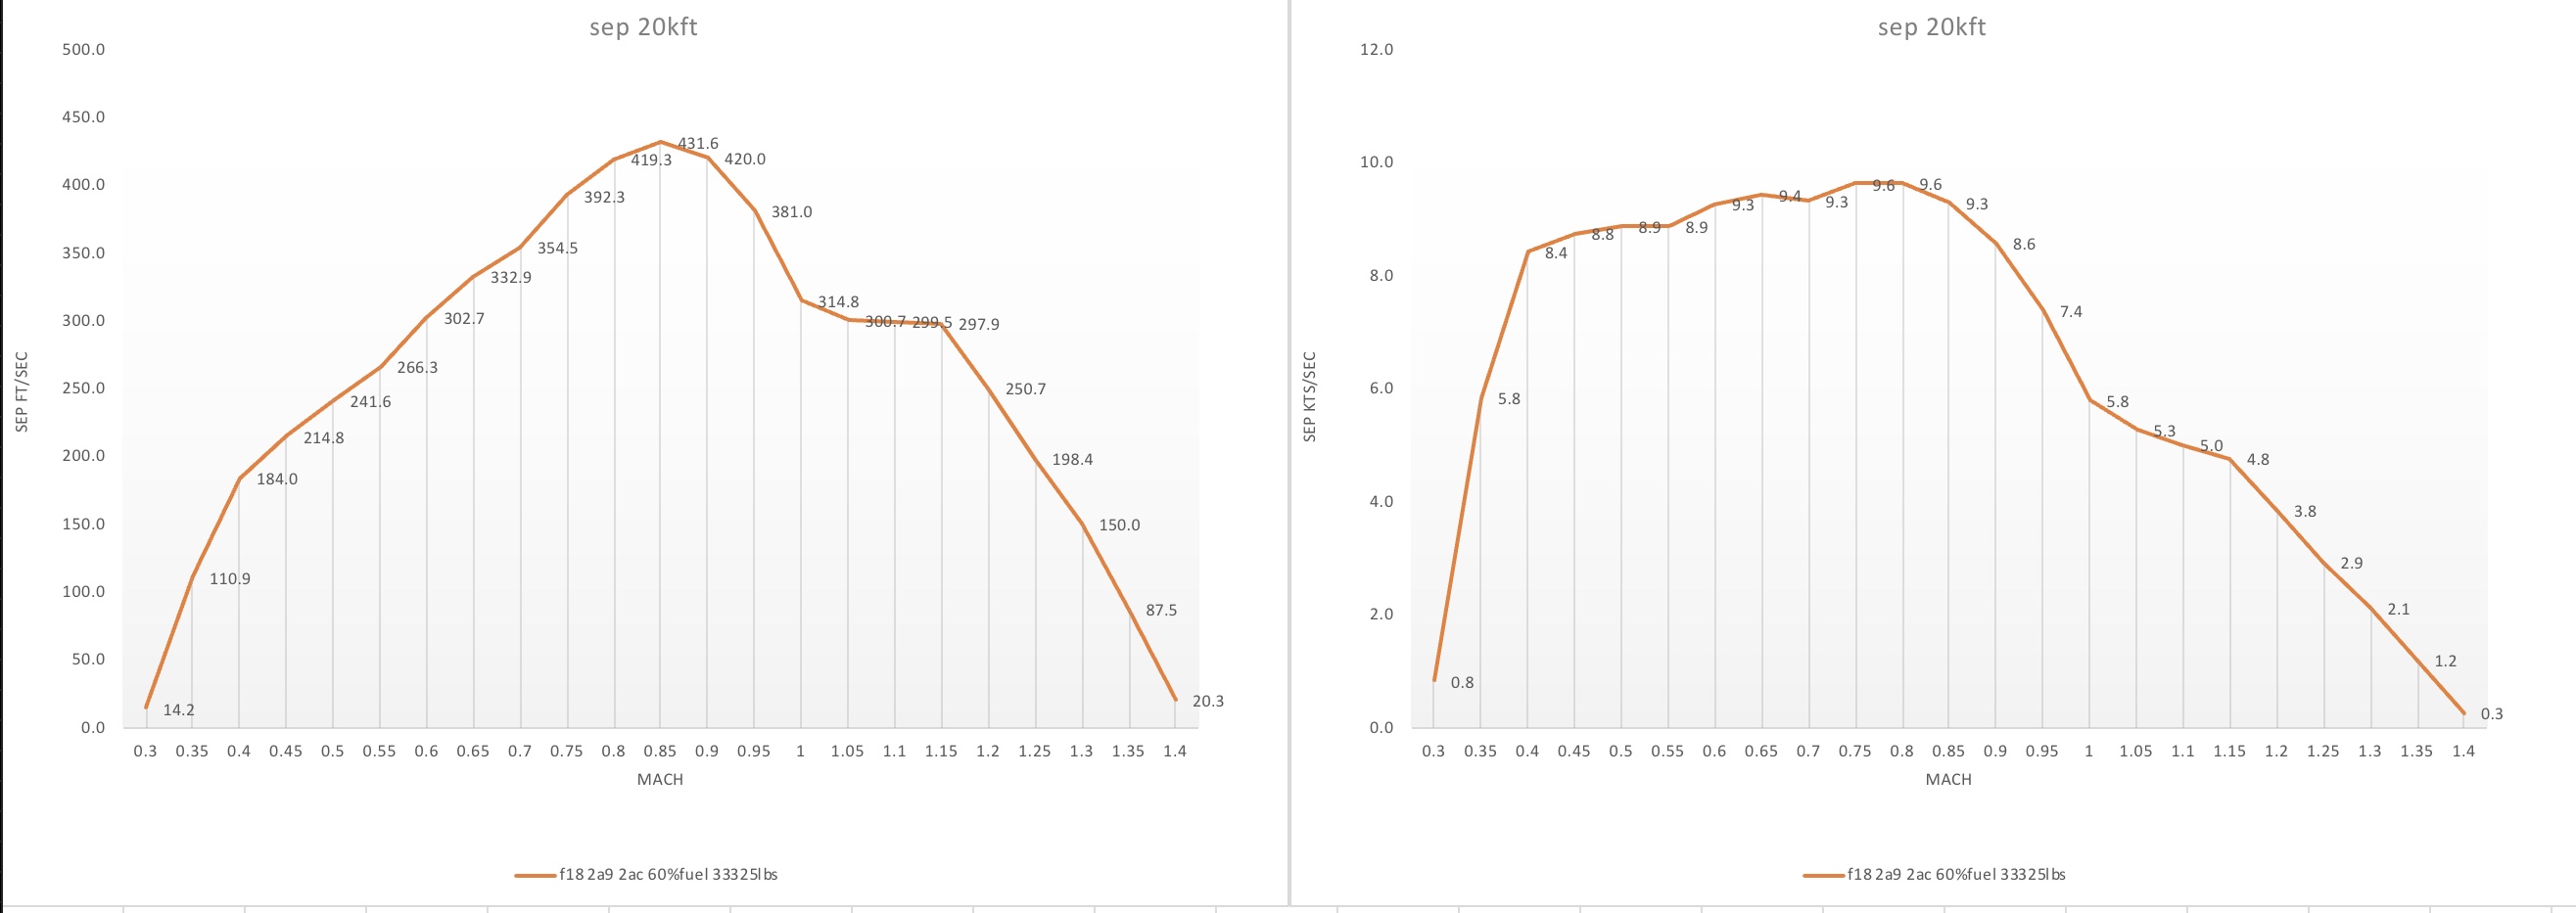
Good work curly Is this probably the reason why sep is still slightly low at m0.9 in game (m0.9, 33325lbs, 2a9+2a120)? 10kft: dcs 647ft/s , gao 699ft/s 20kft: dcs 444ft/s, gao 512 ft/s 35kft: dcs 223 ft/s, gao 247 ft/s Here is the mission if anyone wants to check the above figures. Simply do a 1g acceleration test at the desired altitude. SEP is printed in the logs as m/s and m/s2, which can be converted to ft/s or kts/s to check with gao numbers and envelope… acceleration f18.miz
-
There is zero interpretation on my part regarding those numbers above for the F18 sep nor any chart reading. It is simply copy paste of numbers given by the dod in hearings 1999. That’s the level of precision those guys use to work. And it greatly shows that there is not a easy answer to the f14/f18 acceleration question since there are many variants and lots. And the numbers for the f14 are from the dod (1985 hearings) too. It is however a graph that compares the d with the a model. You can therefore compare different sep states at different mach numbers. Peak acceleration at M0.9 is marked as 640ft/s for the d (what a lousy level of precision they worked back in 85) . And it shows that the d model only has a higher sep up to ~M 1.050001. When I interpret that chart, I do it even more precisely and therefore mark them with a ~ , like: Sep at 10kft , Mach 0.6, Standard day, 60% Fuel: F-14A TF 30: Ps ~320,0000 ft/s (4 /4 ) F-14D F110 : Ps ~405,0001 ft/s (4 /4 ) Sep at 10kft , Mach 1.2, Standard day, 60% Fuel: F-14A TF 30: Ps ~220, 0002 ft/s (4 /4 ) F-14D F110 : Ps ~200,0000 ft/s (4 /4) Since there is no graph I can not give you corresponding read outs for the f18. But there is an envelope chart in the gao report for the epe Hornet. With some math you can convert the sep from kts/s to ft/s. But the level of precision doing so would not be on par with the above data, so I Iet it be...
-
Specific excess power at 10kft , Mach 0.9, Standard day, 60% Fuel: F-14A TF 30: Ps= 500ft/s (4 winders, 4 Sparrows) F-14D F110 : Ps = 640 ft/s (4 /4 ) F-18A Lot1: Ps= 617ft/s (2/2) 400 engine F-18C Lot14: PS= 599ft/s (2/2) 400 engine F-18C Lot15: PS= 699ft/s (2/2) 402 engine F-18C Lot19: PS= 695ft/s (2/2) 402 engine F-18E : PS= 661ft/s (2/2)
-
In dcs, she has kind of a itr plateau like the viper. Above ~20-22° Aoa she cuts the corner and is limited to ~28° Aoa between ~ m0.34 and ~m 0.42 at sea level (clean and with 2a9&2a120). Same picture at 15kft, but here she achieves ~30° aoa at ‘corner’. I think it should be more like 34° Aoa, that is at least what I have red...
-
Hi FightsOn Thanks for your interesting comments. I agree on aoa. ITR seems too low and speed bleed at corner too. What lot did you fly? I ask since my test in dcs seems to show that sep is too low, so I would say she is rather under powered in dcs compared to the rw figures in the gao-report for 402 engine (all tests with 2 aim9, 2 aim120, 60% fuel, 33325lbs) Sep @ 10kft M0.9 Gao 699ft/s, dcs 613ft/s Sep @ 20kft M0.9 Gao 512 ft/s, dcs 420ft/s Sep @ 35kft M0.9 Gao 247 ft/s, dcs 213ft/s She accordingly does not accelerate like in the gao chart: Peak Acceleration : @ 10 kft, Gao ~ 14kts/s, dcs 13.5 kts/sec @ 20kft, Gao ~ 10.5kts/s, dcs 9.6 kts/sec @ 30kft, Gao ~ 7kts/s, dcs 6.4 kts/sec Further more I did not get max speed according the gao chart: 5kft gao m1.17, dcs m1.12 10kft gao m1.27 dcs m1.20 20kft gao m1.47 dcs m1.40 30kft gao m1.65 dcs m1.60 38kft gao m1.76 dcs m1.70 40kft gao m1.75 dcs m1.69 50kft gao m1.64 dcs m1.58 And last but not least I should get from brake release to 50kft and mach 1.4 in 4minutes 9 seconds (A-Modell 6min 15sec.) according swiss evaluation report, but best I get is 4min 15 sec and m1.33... All tests where done with bushmannis script, so measured directly in game. Cheers https://forums.eagle.ru/showpost.php?p=4391704&postcount=28 https://forums.eagle.ru/showpost.php?p=4438052&postcount=58
-
My two cents on F-16 Turn Rate and the EM Diagrams
Figaro9 replied to TheBigTatanka's topic in DCS: F-16C Viper
Hard to tell about weight growth due the reinforced structure since every lot is different... https://www.vtg.admin.ch/en/einsatzmittel/luft/fa18-hornet.html According departure weight clean in above link she is even lighter than the dcs f-18... (Dcs: 36445lbs, linked specs for max to-weight clean: 35’500lbs). Great articles. Training rules do not allow dogfights below hard deck (5000ft, 10000ft...) in rw. In the typical dogfight piece of skies between 10kft and 20kft even the latest and probably heaviest usaf f16 block 50 seems to have a bstr advantage over the f18. Using the haf suppl. charts, correcting for gw-difference, we can compare the b50 bstr to the gao numbers for the f18epe (12.3 dgs: 15kft, 33325lbs, 58% fuel, 2a9+2a120). I get something between 13.1dgs (di=0, 24350lbs, 58%f)and 11.8dgs (di=50, 26740lbs). Interpolated for di20 I would expect best str ~ 12.6 dgs for the b50 (25660lbs). At that altitude, that fuel and wp load, the b50 has probably an adv of~ 0.3dgs if the charts, figures, dcs weights and my read outs are correct... That’s for the heart of the training area heights... Checking for sea level, where many simmers like to fight, the picture looks different: gao for epe: 19.2 dgs, 33325lbs, 2a9+2a120, 58% fuel. For the b 50 I get something between 19.2 (di=0, 24’350lbs, 58%fuel) and 17.9 (di=50, 26740lbs, 58%fuel). Iteration for di20, 25660lbs and I would expect best str to be ~ 18.7dgs for the b50. So the epe seems to have an adv. of ~ 0.5dgs with those specifications at sl, even if she stays within the 7.5 g limit. And since dcs f16 burns internal fuel faster on ab than the dcs f18 does, she starts the fight with more fuel (weight) on airquake servers. Makes it all worse. But the b50 has an huge acceleration, speed and climb advantage (-30% from break release to m1.4 @ 50kft) Ps: dcs f-16 does accelerate in a 9g turn at sea level di=50, 26’000lbs above m0.8. That’s spot on. -
My two cents on F-16 Turn Rate and the EM Diagrams
Figaro9 replied to TheBigTatanka's topic in DCS: F-16C Viper
Yes, the structure is reinforced and there are changes in the software. Lifetime is shorter too. I agree with hb, it is probably 30kft. If you search that homepage, you will even find the figures on the axes. The above ALR chart, shows for Hornet epe, most probably in gao config (60% fuel, 2a9+2a120, 33325lbs) bstr= ~7.4dgs. My Dcs F18 str test in that config, 58%fuel, 33325lbs = 7.3dgs -
My two cents on F-16 Turn Rate and the EM Diagrams
Figaro9 replied to TheBigTatanka's topic in DCS: F-16C Viper
Hi sandman. There were 9g tests with the legacy hornet. And at least swiss hornets do have a 9g-limit. https://ieeexplore.ieee.org/document/789771 https://www.milavia.net/airshows/display-teams/swiss-hornet-display/#img/4 And there are charts for the f-18c showing a 9g limit. http://www.alr-aerospace.ch/index.php?id=fighter-performance-mission-analysis Cheers -
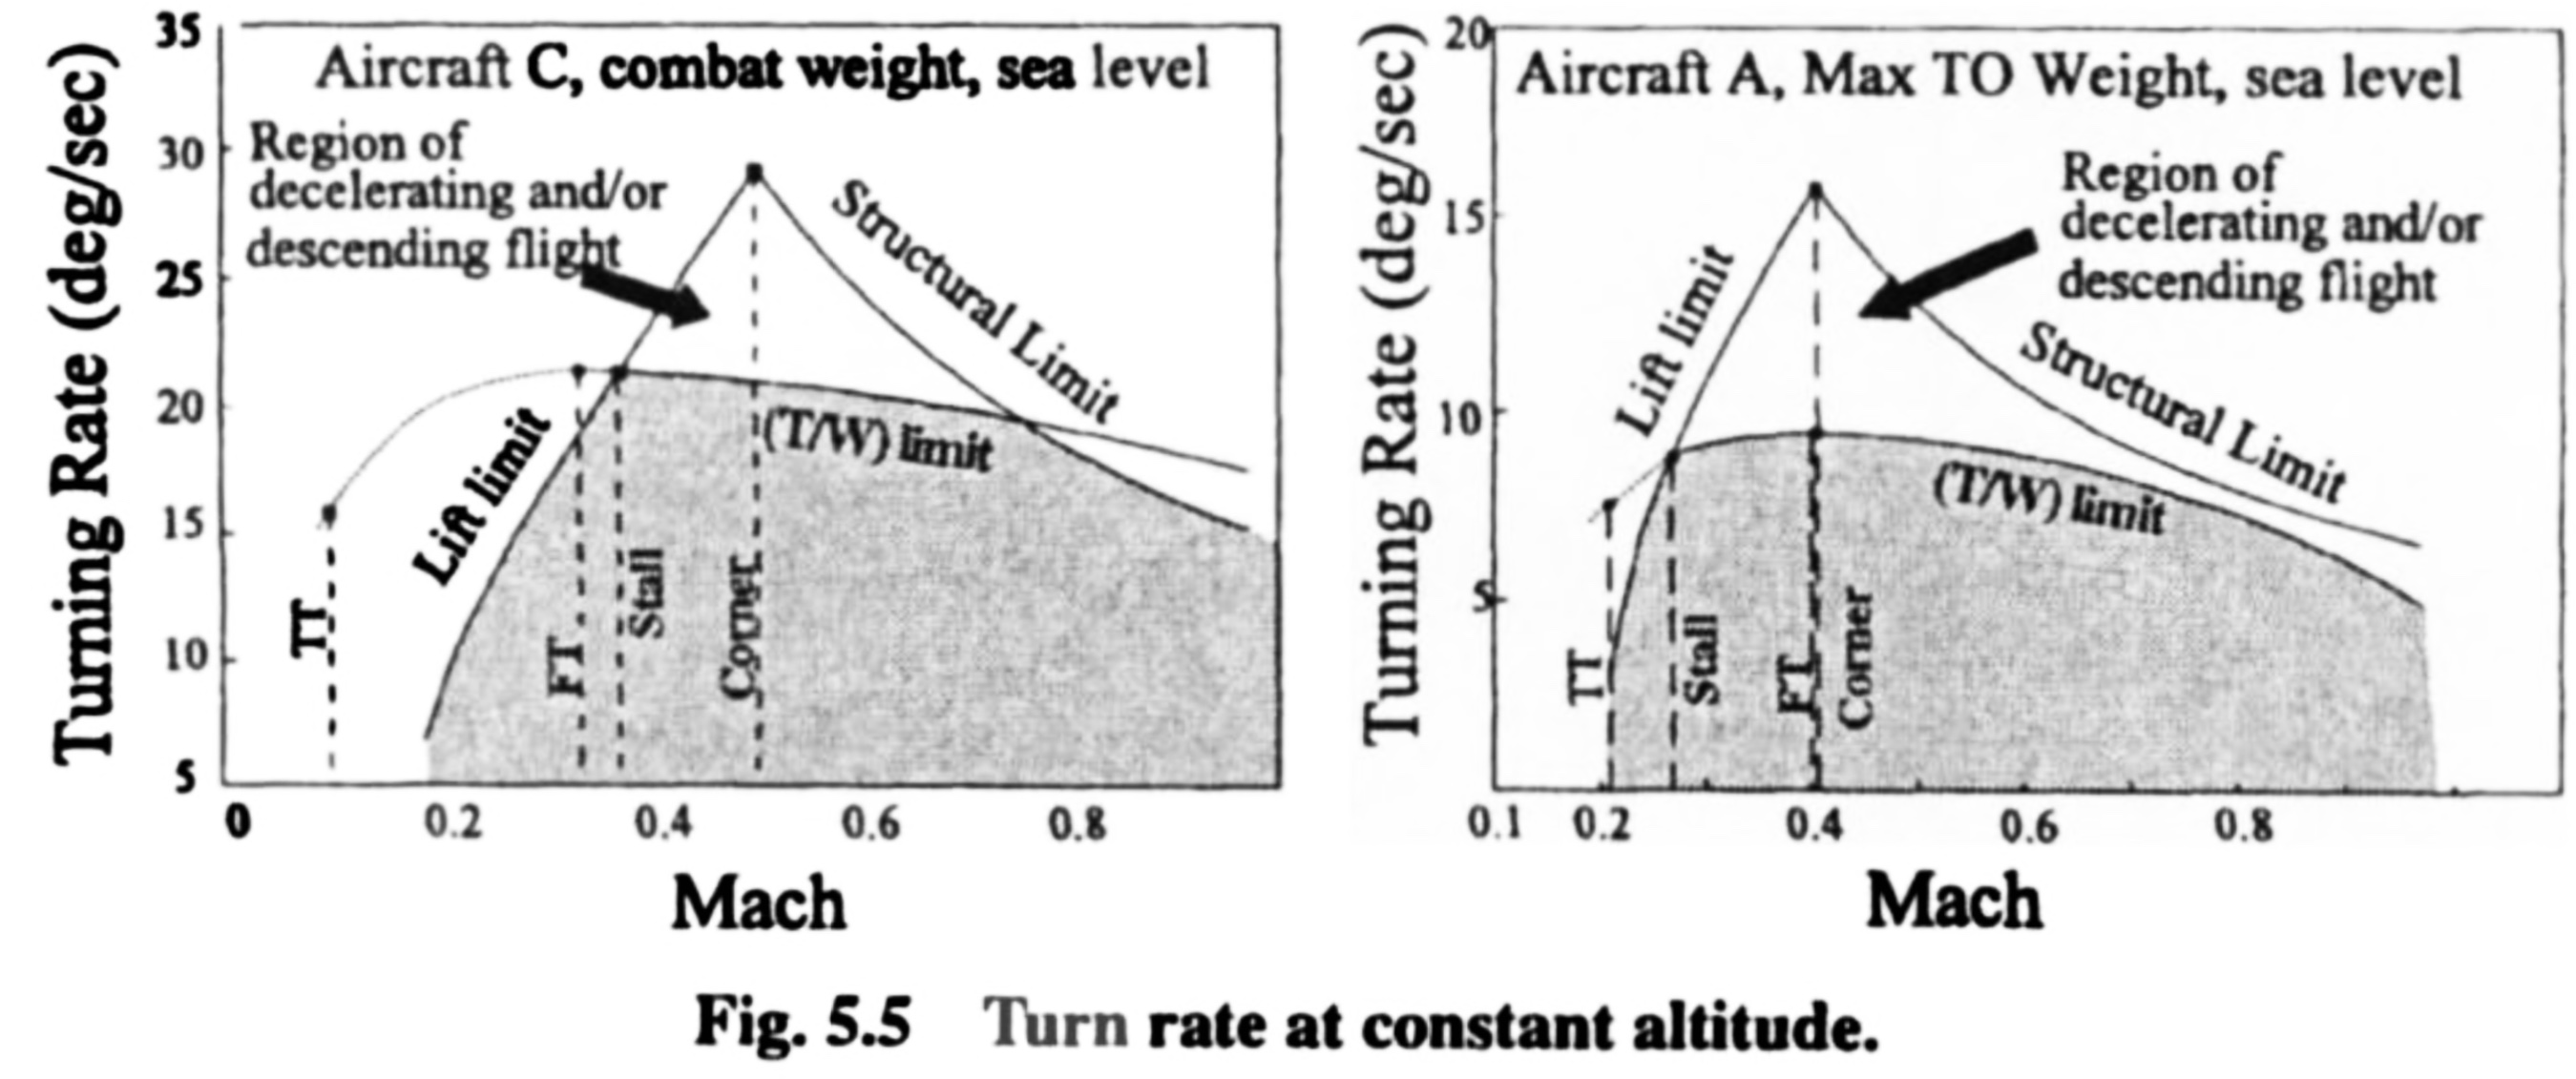
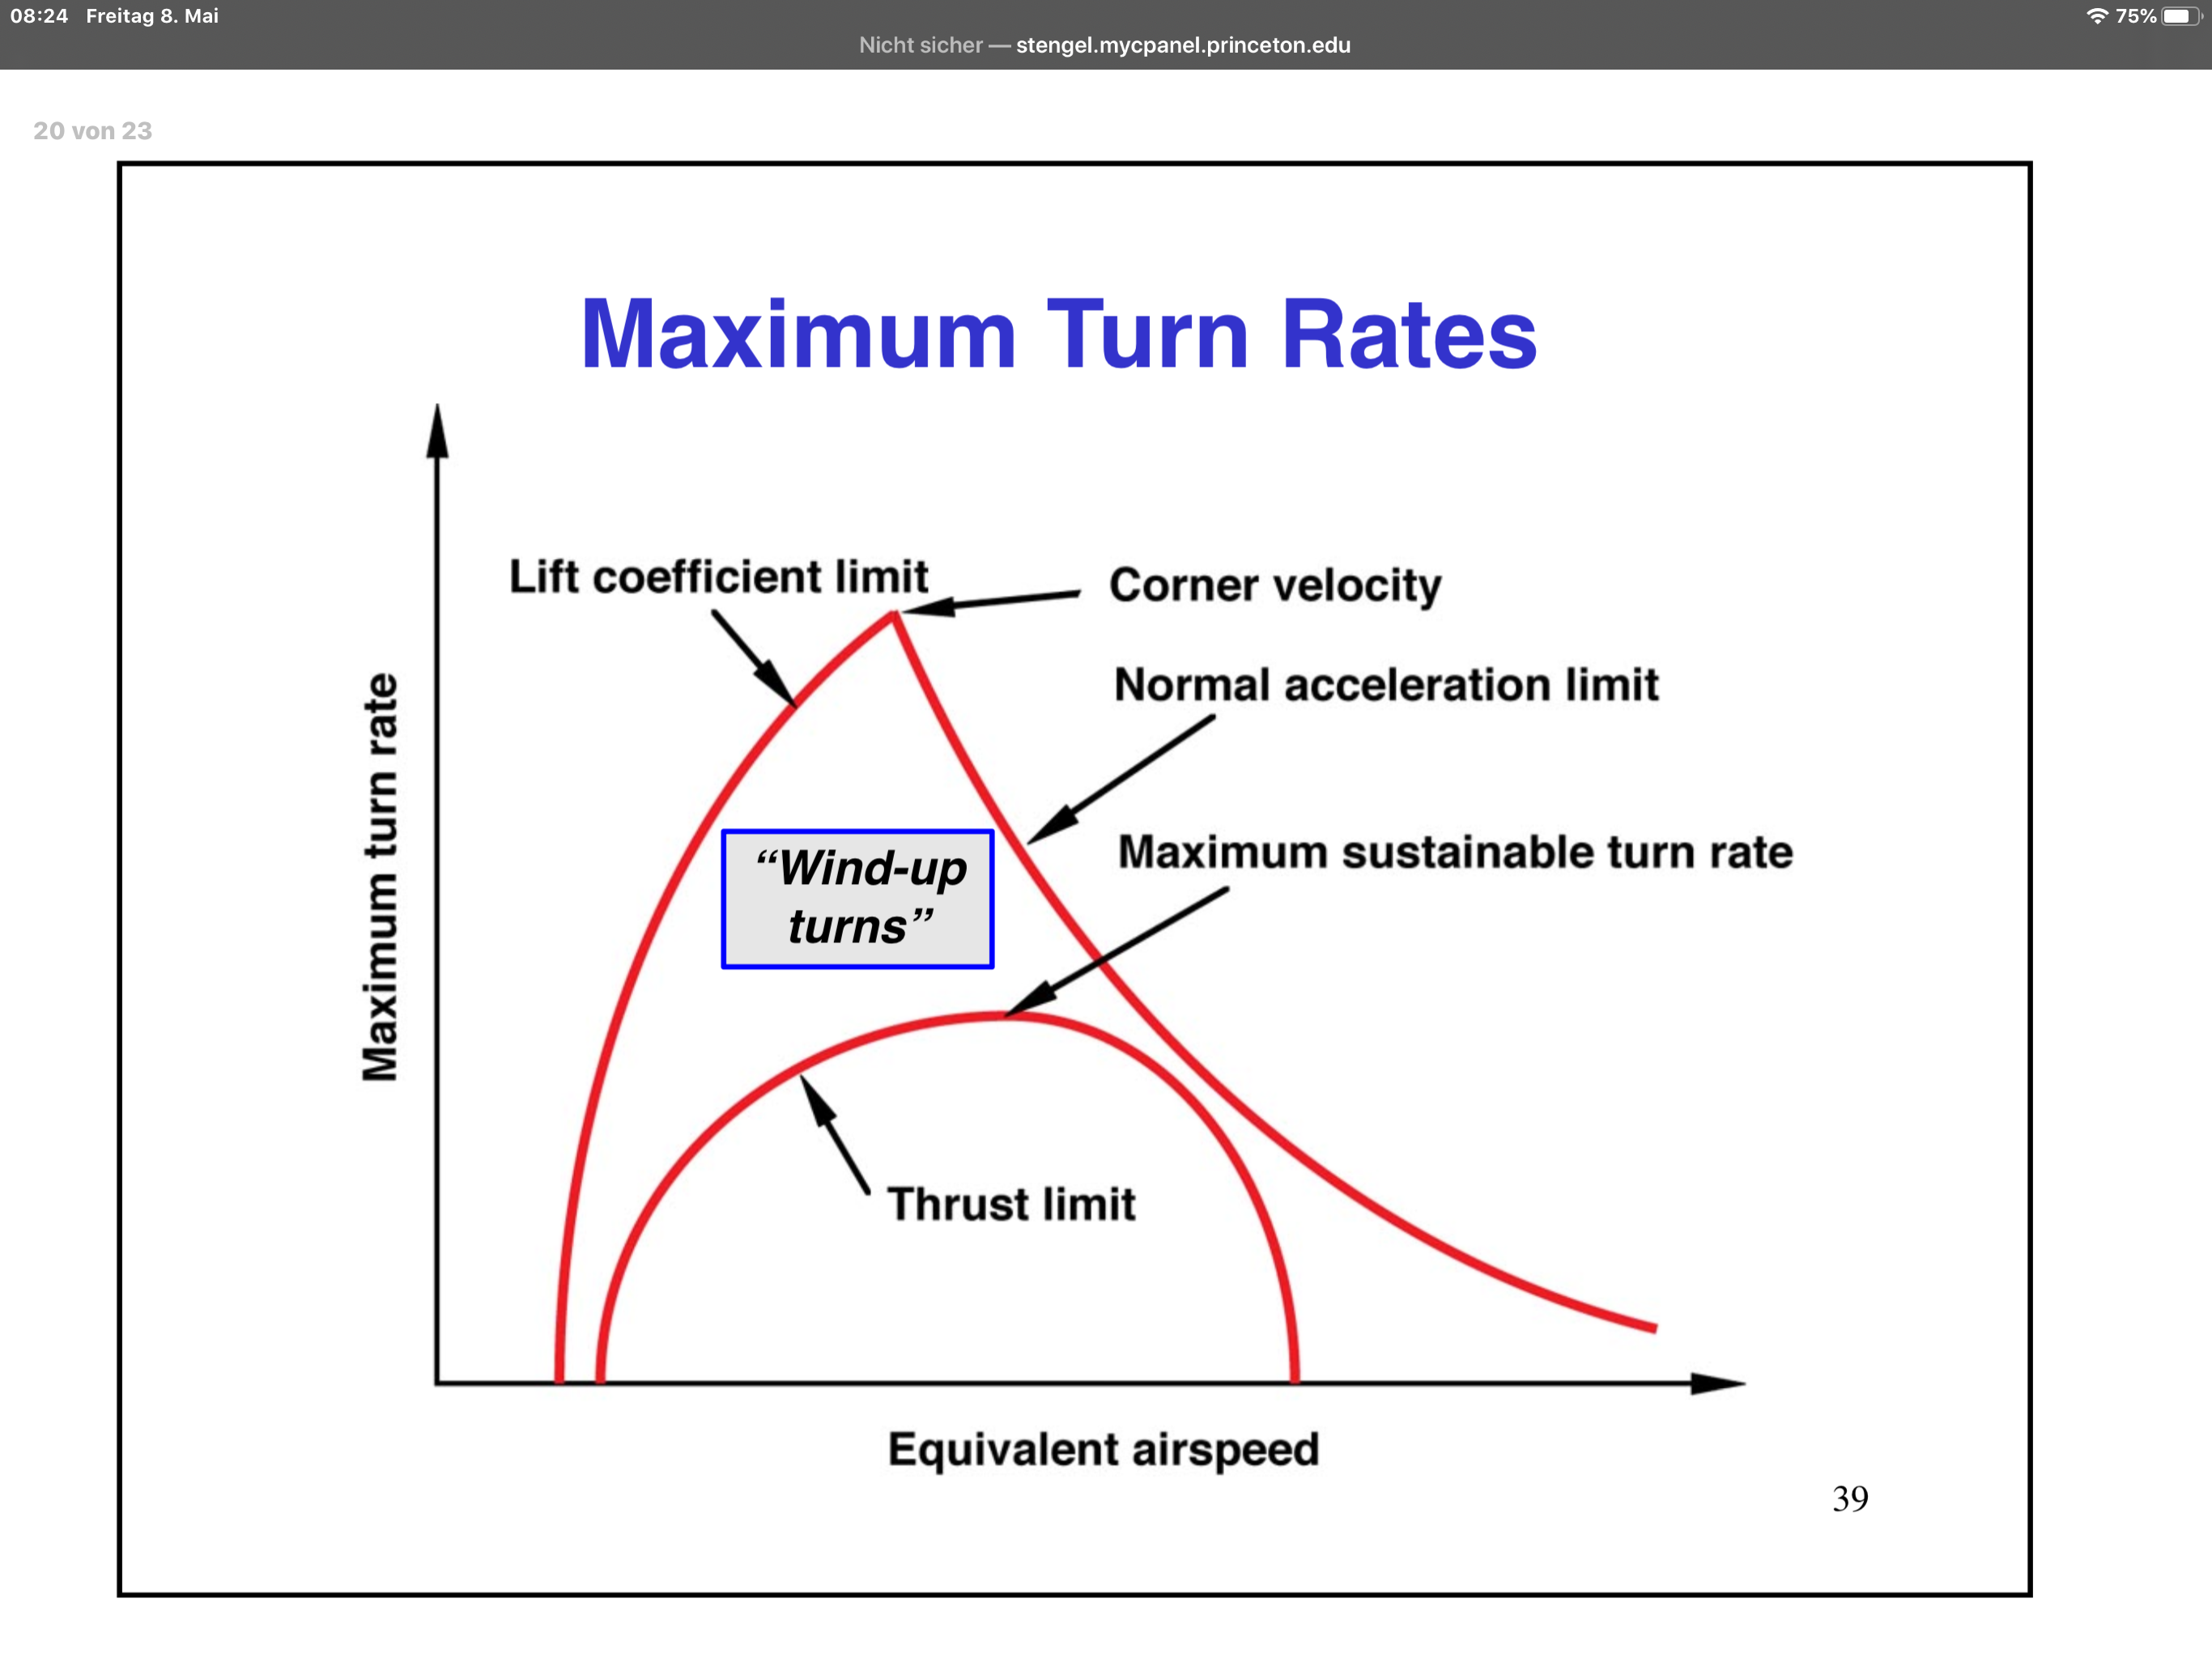
Nice try. Thanks for your kind reply and sorry if I hurt you. But you were off by ~0.5g and that needs to be corrected, right? Reference page was wrong too, but shit happens. Not an ideal thread to post definitions, but since you asked here again: (This time transcripts from different reference books, you probably rather accept that source than in my own words.) Str (region 1 in the chart) „the region below the max t/w curve is one of sustained turn performance. This means that, in this region, the aircraft can maintain a turn rate without decelerating or loosing altitude... In a sustained turn, aircraft maintains a constant altitude and airspeed and the turn radius, turn rate and load factor are constant...“ Itr (region 2 in the chart) „In an instantaneous turn, the aircraft can not maintain these constant conditions, rather the turn entry conditions can only be maintained at the instant the turn is initiated. After turn entry, the airspeed, altitude, or both, decrease... The region where both the lift and the structural limits are sufficiently high but the t/w is inadequate is a region of decelerating and / or descending flight. It is called the region of instantaneous turn performance. In this region high turn rates can be achieved for a brief period of time as the aircraft decelerates (or descends)... From an energy perspective, the sustained turn is a constant energy maneuver, while the instantaneous turn is an energy loosing maneuver... Doghouse The doghouse plot is an aircraft specific turn performance chart that includes the aircrafts envelope boundaries. The overlaid ps=0 curve is the boundary of sustained performance.The aircraft has positive ps below ps=0 curve and negative ps above this curve. an aircraft has its highest turn rate at the intersection of the lift limit and load factor limit at the top of the doghouse(cp). This is an instantaneous turn rate, since ps is negative at this point.“ Hope that transcription helps you to get rid off your derangement(str @ ps-1000 and so on). If not, pm me, I will send you additional material. Ps: itr is usually tested with wind up turns in rw...
-
[NO FM CHANGES IN UPDATE] Flight Model/Engine Thrust Tweak?
Figaro9 replied to wilbur81's topic in DCS: F/A-18C
I did max speed-tests a while ago: I started at 50kft M1.6 and dove to the test altitude. Here is what I got: https://forums.eagle.ru/showpost.php?p=4391704&postcount=28 Checked sep too in 1g acceleration tests (standard atm.), see attachments. Sep @ 10kft M0.9 Gao 699ft/s, dcs 613ft/s Sep @ 20kft M0.9 Gao 512 ft/s, dcs 420ft/s Sep @ 35kft M0.9 Gao 247 ft/s, dcs 213ft/s Ps. Based on those sep charts I managed to reach 49kft & M1.33 from brake release in 4min 15sec.
-
FM is more accurate than your chart reading, try again.
-
Here is probalbly a hint that the dcs-hornet is performing slightly below rw-data. At page 84 in gao there is an air speed envelope comparison between f18 c/d (402 engine) and e/f Here is the comparison between the gao report and my dcs test today (F18c (F404 GE402) 2aim9, 2 aim120, 33325lbs (60%fuel) ) 5kft gao m1.17, dcs m1.12 10kft gao m1.27 dcs m1.20 20kft gao m1.47 dcs m1.40 30kft gao m1.65 dcs m1.60 38kft gao m1.76 dcs m1.70 40kft gao m1.75 dcs m1.69 50kft gao m1.64 dcs m1.58 .trk is far too long and too big, but people can easely verify... Also did the SAF a climb/acceleration comparison between F16 and F-18 in the evaluation process. The Hornet Epe should get from brake release on rwy to 49’000 feet and mach 1.4 in 4min 9 sec in rw with 2 aim9 and 2 aim120 (source: swiss evaluation documentation.) CF-18, used in the initial evaluation phase, needed 6min 15s... My best test result in that load out and config: in 4min 9sec was 49kft and m1.13 instead of m1.4, but there are probably better profiles? f18 climb 49000 m1-15 3-53.trk
-
[CORRECT BASED ON AVAILABLE CHARTS] Underpowered ?
Figaro9 replied to FastNotFurious's topic in DCS: F-16C Viper
mach 2.04 can be sustained at 38'000ft. Initially 25000lbs, clean, 50kft. then dive and accelerate to 38'000ft m2.04. that's according block 50 charts f16 m2 38000ft.trk -
[CORRECT BASED ON AVAILABLE CHARTS] Underpowered ?
Figaro9 replied to FastNotFurious's topic in DCS: F-16C Viper
SAF did the following (rutowski) profile for evaluating f16 vs f18epe. F-16 profile (4*aim9L) from break release to 49’000ft and M1.4 : 1) TO, accelerate to peak acceleration (~m0.9). 2) Gently pull and climb while holding M0.9 to M0.95 . 3) Level off @ 28’000ft and accelerate thru sound barrier (hold -0.5g) to mach ~ 1.2. -0.5g phase lasted ~ 45s... 4) climb to 49’000ft and M 1.4. The profile took 3min. and 7 sec. for the F16 in rw and 4min 9sec. For the f18 epe with 2*aim9 & 2 a120. I tried this profile with dcs block 50( 26000lbs, 4*aim9. 15deg C ) 40kft took 2min 20sec. 49kft took 3min. 3. Sec f16 climb 49000 m1-4.trk -
Also bei uns war keine Erlaubnis vom Tower nötig für den Triebwerkstart. Über den Flugplan wussten die eh Bescheid wann welcher Flieger übernommen und gestartet werden würde. Der Triebwerkstart wurde nur mit dem Flugzeugwart und per Handzeichen ˋkoordiniertˋ . Erster Funkkontakt war mit dem Leader /Wingman (oder Sohn wie wir ihn nannten), sobald der start up beendet und man ready for taxi war... Die Funfgeräte (sowie alle weiteren elektrischen Geräte) wurdeN immer erst nach Triebwerkstart in Betrieb genommen.
-
Probably you should. I am not saying that it isn’t a bug for sure, just saying that by diving one can get 9 g at M0.69 and that you can achieve the rates according the chart. If you do the very same test with the hornet, you neither achieve max g (7.5) during the hole maneuver… one can not climb the hill up do corner speed on the g-limit line neither.
-
I really hope so. If one thinks your strange thesis to an end, then instantaneous turn rate would not even exist at all. Then even corner speed would be sustainable at -680fps. Nope, no way to sustain rates above the ps=0 region. Your loosing speed and/or altitude. It is the instantaneous region.
-
Just to finally clear up some definitions: There are two different types of turn rates, rates that can be sustained (ps=0 or ps>0) and instantaneous turn rates (ps<0). Sustained turn rates means no energy is lost, speed and altitude can be maintained because there is enough thrust... There is no way to improve str by diving, because one of the two preconditions (no speed and altitude loss) is obviously not met then. Instantaneous turn rates are momentarily, you loose energy (altitude and/or speed) in this ps<0 region. It is the region between the envelope limits (aoa, g) and the ps=0 curve. A slice is an instantaneous maneuver, since you loose altitude while maintaining speed. Therefor diving can improve your it turn rate if you are not at the border of the envelope already. You messed that up in your post #7, 10 and 14. For further info this link might help https://books.google.ch/books?id=kaqvC4e_EKcC&pg=PA135&lpg=PA135&dq=what+does+instantaneous+turn+rate+mean&source=bl&ots=BLIavb0_ZA&sig=ACfU3U1qKxDq9KK6w_aDZ2TNSOGIdy995g&hl=de&sa=X&ved=2ahUKEwjF_ZbJgpXpAhUjyKYKHR70AMIQ6AEwEXoECAkQAQ#v=onepage&q=what%20does%20instantaneous%20turn%20rate%20mean&f=false Page 135, 136
-
you are probably wrong again. Guess teachers from usaf test pilot school would disagree with your thesis too: 9.9 instantaneous maneuverability 9.9.2 structural limitation ... Even among high performance aircraft, there is only a small portion of the flight envelope in which limit load can be maintained in level flight, although it can be achieved in maneuvers such as dives and pullouts through a much larger portion of the envelope. source: Performance flight test phase, Chapter 9 Energy, August 1991, usaf test pilot school, edwards afb.
-
Thanks for your small but important correction. So we agree that up to M0.66 ITR (and g) looks according rw chart. Let‘s have a look at the above mach numbers, where energy loss (speed, altitude or both) is gigantic (more than 600fps) Instantaneous turn-rates are turns which are above the maximum sustainable-rates (fps= 0). you can not sustain -600fps, you loose altitude, speed or both. Remember, sustain means no energy loss. Beside L(max), there are other factors for ITR, like (achievable) g and speed. Diving has obviously an impact on achievable g , as shown in my trk. By descending, speed decreases slower in the turn and g can build up, up to 9g as proven. I recommend to read the part ‚turn performance‘ in the manual page B8-4. There is a good example for how to read the chart (a f16 @ sl di=0, can turn 9g and climb instantaneously almost 36‘000ft (600fps) at mach 0.9) . Tested ITR (and achievable g) in game do correspond with rw charts as far as i can see.
-
At M 0.66 you get 8.7 g in game? that corresponds nicely to rw data. According the rw chart you need to dive with more than 36`000ft per minute (600fps) to get the `corner` rates between M0.54 and M 069. So you need to dive for testing... In attached track file I start to dive at ~M.071 at 1800ft. I dive with approx 13`500ft per minute and start pulling harder at M0.7. That way I reach 9g at M0.69 which is according the book. I have tested different speeds. all logs are turn rates measured in game again, no third party program: M0.710 21.2 dgs M0.685 22.0 dgs M0.682 22.1 dgs M0.667 22.1 dgs M0.640 22.3dgs M0.613 22.6 dgs M0.606 22.7 dgs Rates are looking good to me itr f16 sl di50 m0.68 .trk